
Nutrition
Reading time: 24 minutes
Alice Garvey and Jonathan Norman
Background
The CCC estimates that 11% of UK GHG emissions are attributable to agriculture and land use, and predict that the sector will become a major emitter in 2050 (based on 2016 data; p. 12, CCC, 2018). The food and drink industry also represents 7% of the UK’s industrial GHG emissions (Hammond, 2018). As the ultimate driver of agricultural and related emissions, we consider how changes to the quantity and type of food demand could contribute to UK low energy demand pathway by 2050. This analysis adopts the framework of ‘avoid, shift, improve’ to reduce the energy demand of meeting the energy service of nutrition (Creutzig et al, 2018). We consider three key options for constraining energy demand in the sector, which cover each stage of the UK food system, and address the major current sources of inefficiency and emissions-intensity. The food system presents particular challenges in considering energy demand, given that non-energy emissions are more significant in the sector, relating to land use change (LUC) and livestock (ruminant enteric fermentation).
As strategies to ‘avoid’ energy demand, we consider the effect of calorific intakes being brought in line with Government Dietary Recommendations (i.e. healthy levels), and in reducing supply chain food waste. Calorific intake is the determinant of the volume of food demand per capita. The UK is challenged by overconsumption, with approximately 65% of the population of England estimated to be in ‘overweight’ or ‘obese’ BMI groups as of 2017 (NHS Digital, 2018).
Ensuring calorific intake is at guideline levels would reduce food demand, whilst promoting several socioeconomic co-benefits such as improved health outcomes, reduced cost of household food expenditure, and lower costs associated with the disease burden for public services.
Reducing food waste and losses across the supply chain is a key public policy target, as cited in the recent Resources and Waste Strategy (HM Government, 2018). It is also a means of avoiding additional food demand, by making more efficient use of the food that is currently delivered through the UK food system. WRAP report that the cost associated with household food waste in the UK was £14.9 bn in 2015, creating equivalent emissions of 22MtCO2e for the same year (p.4, WRAP, 2018). Minimising avoidable food waste rates across the supply chain would result in lower final food demand, as a resource efficiency improvement, as well as providing cost savings across the supply chain. In developed nations the majority of food waste occurs downstream, that is, at the consumer stage (Smith et al, 2014), whilst in developing regions refrigeration and transport technologies incur greater losses earlier in the supply chain. As Bajželj et al, (2014) indicate, food waste reduction is more effective downstream given the embodied energy demand of the product by that stage. This is therefore one of our core energy demand reduction strategies in the analysis.
As part of a strategy to ‘shift’ energy demand, we consider the role of dietary transitions to more sustainable food products. Approximately 18% of global GHG emissions are attributable to livestock production (p. 83, Stehfest et al 2009), with ruminants posing the largest single anthropogenic methane source (p. 84, ibid), and occupying 25% of global land for grazing (ibid). Additionally, projected demand for meat and dairy products is expected to double globally by 2050 (p. 491, Garnett, 2009). Meat consumption is positively correlated with affluence, with many developed nations consuming more meat than is nutritionally required (Godfray et al, 2018). Meanwhile, red meat consumption (i.e. ruminant meats such as beef and lamb) is widely associated with worse health outcomes, for instance cardiovascular and other non-communicable disease (NCDs) (Willett et al, 2019). This scenario envisages a shift to plant-based diets as an extension of the recent trend for reduced meat consumption. From 2014 to 2018, the number of vegans in the UK is reported to have increased by 450,000 (The Vegan Society, 2019). Of this number, 42% of vegans were reported to have switched to this diet during 2018 (ibid).
To ‘improve’ the energy demand associated with the UK food system, we consider the potential for greater agricultural and industrial efficiency, primarily through new or best practice technologies. The BEIS Updated Energy and Emissions Projections indicated that there had been marginal change in emissions (CO2 only) in the agricultural sector between 1990 and 2016 (Annex C: Carbon dioxide emissions by IPCC category, BEIS, 2019). However, in the industrial food system there were reductions of 50% in CO2 emissions (ibid). This correlates with the Roadmaps, which indicate that there have been large reductions in the food and drink processing sector since 1990 (CO2 emissions) due to decreasing use of fossil fuels and a fairly constant trend in electricity consumption (DECC and BEIS, 2015a). There are therefore some remaining efficiency opportunities with implementation of technologies such as anaerobic digestion, improved packaging and refrigerant use (Audsley et al 2010).
Evidence and assumptions
| Mitigation option | Functional unit | Value in 2050 | |||
|---|---|---|---|---|---|
| Current | Baseline | Low ambition | Shift | ||
| Recommended calorific intake | Kcal/pc/day (for the average UK adult) | 2871 | 3154 | 2686 | 2500 |
| Dietary transitions | % omnivores in UK population | 66.5% | 29% | 17% | 5% |
| % healthy diet in UK population | 21% | 25% | 27% | 28% | |
| % vegetarian in UK population | 9.5% | 31% | 36% | 42% | |
| % plant-based in UK population | 3% | 15% | 20% | 25% | |
| Food waste reduction | % reduction pa in 2020–25 | – | 2.25% | 2.5% | 3.33% |
| % reduction pa in 2026–30 | – | 2.25% | 2.5% | 3.33% | |
| % reduction pa in 2031–35 | – | 2% | 2.5% | 3.33% | |
| % reduction pa in 2036–40 | – | 2% | 2.5% | 3.33% | |
| % reduction pa in 2041–45 | – | 2% | 2.5% | 3.33% | |
| % reduction pa in 2046–50 | – | 2% | 2.5% | 3.33% | |
| Cumulative reduction against 2020 levels (%) | – | 62.5% | 75.0% | 99.9% | |
Healthy calorific intake (avoid)
The calorific intake scenarios assumed the need for transitions to promote optimal public health and we consider what the associated emissions reduction would be with a reduction in overweight and obesity levels to 2050. Baseline calorific intake was calculated using official statistics, namely the Family Food Survey (Defra, 2018). A correction for underreporting was incorporated (Harper and Hallsworth, 2016), resulting in an assumed average UK calorific intake of 2871 kcal per day per capita excluding additional calories from food bought but not eaten.
To project baseline calorie change, historic trends were extrapolated using FAOSTAT data (FAO, 2020). This increased per capita calorific intake to 3154 kcal in 2050. The Shift demand case assumes that average adult intake is 2500 kcal (per capita, per day) in 2050 in line with the GDR for adult men; for women recommended consumption is 2000 kcal (PHE, 2016). A gender weighted average consumption for the UK adult population would be 2250. Our assumption of 2500 kcal allows a buffer of additional calories beyond the minimum, accounting for different levels of physical activity and metabolic rates. It remains a substantial reduction from current consumption levels.
Recommended calorific intake is dependent on demographic factors such as age. We weighted the calorie scenarios by age groups according to the GDRs and Office for National Statistics population projections, taking an average value between genders (PHE, 2016; ONS, 2019). It is assumed that moderation of calorific intake to healthy levels only occurs in individuals between 15-64 to which the 2000 (female) and 2500 kcal (male) GDR applies (PHE, 2016). The calorific intake of age groups 0–1, 2–3, 4–6, 7–10, and 11–14 are fixed according at the level of the GDRs.
Reduced food waste across the supply chain (avoid)
Available data on food waste is of relatively poor quality, consistency, and rarely up-to-date. We aligned estimates of supply chain food waste (Caldeira et al, 2019) and estimates of avoidable waste per food group (Bryngelsson et al, 2016) to the COICOP classification. Waste of liquids was not included since there is arguably no avoidable fraction of liquid waste. In the baseline case, trends in FWR were extrapolated to 2050, resulting in per annum reductions of 2.25%. In the low ambition case, Sustainable Development Goal 12.3 is assumed to be met, halving food waste by 2030 (against 2015 levels) (United Nations, 2019), and a comparably ambitious target set from 2030-2050. In the Shift demand case, all avoidable food waste is eliminated in the UK. The percentage reductions were assumed to be linear. The waste rate time series were then input to the calorific demand profiles as a multiplier, indicating the quantity of additional calories required by UK consumers due to food waste.
Modal shift to sustainable diets (shift)
To calculate baseline dietary intake, the composition of an average national diet in percentage calorie intake per food group was determined (by COICOP categories), drawing on data from the National Diet and Nutrition Survey (NDNS) (PHE, 2019). We considered 4 diet types profiled in the literature and their composition by food group, namely: omnivorous, healthy, vegetarian, and vegan. The ‘healthy’ diet appears frequently in the literature and generally involves lower red meat consumption under both public health and climate change rationales.
The inclusion of an average ‘healthy’ diet rather than prescriptive pescatarian or poultry-only diets allows greater flexibility for individual choice in the construction of personal diet. Seventeen diets across six key studies were used (Haddad and Tanzman, 2003; Bryngelsson et al, 2016; Allès et al, 2017; Bradbury et al, 2017; PHE, 2018; Willett et al, 2019) and percentage composition in calories (kcal) was calculated. The use of percentage composition allowed diets to be isocaloric, often a limitation of diet modelling studies where total vegan calorific intake is commonly lower than for omnivorous diets.
An ‘average’ of literature-based dietary compositions was calculated for each of the four headline diet types since the profiles of indicative diet types are highly variable between analyses. Assumptions of the relative shares of each diet type in the population were then made and a weighted average national diet constructed.
In the baseline case the recent trend in uptake of vegan, vegetarian and reduced meat diets is predicted to continue. Empirical data on current dietary composition in the UK is limited, and often only available as ad-hoc surveys (Waitrose & Partners, 2019; YouGov UK, 2017). Similarly, many studies and national datasets are subject to both mis- and under-reporting. For example, purportedly vegetarian participants have reported consumption of red meat (Bradbury et al, 2017), and one ‘vegetarian’ scenario in Bryngelsson et al, (2016) includes consumption of beef from dairy cattle. National dietary data collection efforts are known to under-report, for instance the NDNS (Harper and Hallsworth, 2016; PHE, 2019). There are no clear datasets which fully reflect the widely reported changes in consumption patterns in the UK, for example relating to the ‘year of the vegan’ (assumed to be in 2019) (Hancox 2018; Jones, 2018). A combination of sources was used to infer trends of plant-based diet uptake at the national scale (Ipsos MORI, 2016; Waitrose & Partners, 2019). Given the lack of baseline data on diets, in projecting change forwards, the scenarios are based on qualitative assumptions of a general direction of travel input logistically to the model.
Principles
The following provides an overview of how the nutrition scenarios satisfy the 4 core principles of the LED pathway:
- Reductions in energy demand maintain or improve quality of life for a large majority of the population.
- There are significant public health co-benefits to dietary shifts to lower meat consumption and in moderating calorific intake (Willett et al., 2019).
- Reduced meat consumption could reduce household food costs, although the rebound potential for greater spending on other food products and in other consumer categories should also be considered (Grabs, 2015).
- Greater demand for meat-free products could drive price reductions in alternative proteins and allow greater consumer choice, incentivising meat-free diet types. This is already in evidence with the so-called ‘vegan halo’ effect (Godwin, 2019).
- Reducing calorific intake to levels in-keeping with the Government Dietary Recommendations would improve both health outcomes, particularly incidence of non-communicable disease (NCD), and quality of life (more ‘quality adjusted life years’, QALYs).
- ‘Overweight and obesity-related ill-health’ cost the NHS £6.1bn from 2014-2015 (Public Health England, 2017). Improved public health associated with changed diets and calorie intake would reduce the economic cost of the burden of disease in the UK, reducing pressure on public services and allowing greater spending in other priority areas.
New technologies can have a positive effect on reducing energy demand by introducing new information to energy users and providing alternative business models and the promotion of novel energy services.
- New technologies would allow optimisation within the UK food supply chain to reduce food waste and deliver goods more efficiently. Trends towards centralised retail and distribution (i.e. warehouse retailing and home delivery, without supermarkets) could contribute to energy demand reduction in the food sector, whilst creating new business structures for food retail.
- Nutrition tracking technologies at the consumer end also have a role in moderating moderate calorie intake and promoting healthier diets. Information provision around embodied energy/emissions in food could also stimulate behaviour change in food buying.
Apps and other IT-enabled services currently allow redistribution of excess food, reducing food waste. - Greater demand for plant-based goods and vegetable proteins would create a market space for such products, and reduce the ‘food desert’ effect in many regions (Mills and Wright, 2015) . This also provides significant potential for innovation, with positive impacts on the UK economy already being reported; the meat-free food market was worth £572m in 2017, an increase of £33m from 2 years earlier, with projected growth to a £658m valuation by 2021 (Jones, 2018).
They promote equality, avoiding increases or reducing distributional impacts.
- Greater market demand could drive price reductions for following alternative diets, and allow greater consumer choice in products.
- Policies to moderate calorific intake such as the existing sugar tax, and prospective meat/fat tax could have negative distributional outcomes (Chalmers et al., 2016). Healthier food is generally associated with higher consumer costs (Tong et al, 2018). To avoid regressive taxation of certain food groups, policy would need to be carefully designed, to avoid potential nutritional deficiencies as a result of differential food costs.
- Policy would also need to consider access to food products in response to the current trend of ‘food deserts’, where good quality food is relatively inaccessible (Mills and Wright, 2015).
- Waste reduction in the food supply chain could create cost saving opportunities for retailers, which could potentially transferred to consumers.
- Increasing the proportion of domestic production could result in cost savings for UK retailers and consumers, as well as potential job creation in the UK food and drink industry.
- An important caveat is that calorie overconsumption should not be considered a ‘blanket’ issue for all UK households, and is often the product of multiple social drivers. Parallel issues around unequal access to healthy food and the proliferation of food ‘swamps’ and food ‘deserts’ should be considered to avoid demand-side policy which exacerbates existing inequalities.
Rates of change are truly transformative but also have a basis in historical patterns of change while also not breaking physical laws.
- The recent Climate Change Committee Net Zero report indicated potential for a 20% reduction in meat consumption over the 30 years to 2050 (CCC, 2019). Based on the extrapolation of current trends towards reduced meat consumption (but noting the potential low longevity of the trend) these estimates are in line with reasonable possibility given the reported 350% increase in the number of vegans in the UK between 2006-2016 (Ipsos MORI, 2016). The demographic weighting of this trend (i.e. veganism is more prevalent in younger age groups) also suggests exponential uptake towards 2050.
- Given the recent trends in diet change have occurred ‘organically’ or without policy-intervention, the scope for additional change towards 2050 is particularly promising.
- The scenarios for calorific intake are particularly transformative given the lack of precedent in reducing obesity rates in the UK, and given that approximately 65% of UK adults were classed as overweight or obese in 2017 (NHS Digital, 2018).
- Our scenarios of transformative change in calorific intake are ambitious but rooted in what is physically possible by assuming a conservative average calorie intake per capita (e.g. 2500 kcal, which accounts for variations in metabolic rate, gender, age), informed by assumptions in Willett et al, (2019)
- Food waste scenarios are transformative in envisaging near zero rates of avoidable waste, assuming the future availability of new technologies to promote efficiency in this area.
Methods
The mitigation scenarios of varying ambition levels were developed with reference to the literature, and then integrated according to the ambition levels to overarching ‘food system pathways’. A hybrid physical input-output (IO) model of the UK food system was developed to implement the scenarios
(Figure 1).
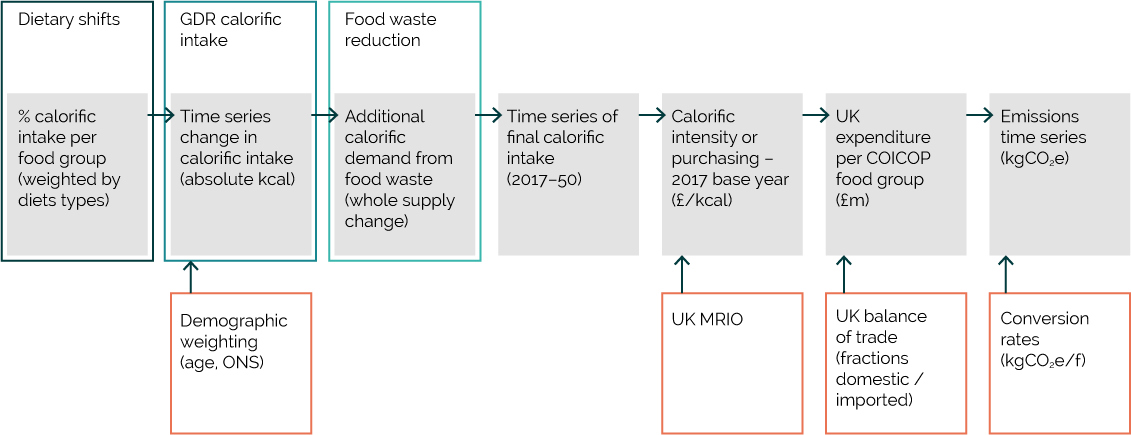
Image text
Dietary shifts, represented by % calorific intake per food group (weighted by diet types) feed into GDR calorific intake, as a time series change in calorific intake (absolute kcal) with data from demographic weighting (age, ONS). This then leads into Food waste reduction, quantifying the additional calorific demand from food waste (whole supply change). The next step is a time series of final calorific intake (2017–50), then calorific intensity or purchasing – 2017 base year (£/kcal) modelled through UK MRIO. This is followed by UK expenditure per COICOP food group (£m) from the UK balance of trade (fractions domestic / imported). The final element is an emissions time series (kgCO2e), with conversion rates (kgCO2e/£).
| Demand-side mitigation | Mitigation in the food system | Functional unit(s) |
|---|---|---|
| 1. Avoid | Healthy calorific intakes | ∆ Kcal/pc/pa |
| Reduced food waste across the supply chain | % reduction in food waste | |
| 2. Shift | Modal shift to sustainable diets | % intake of each food group per year (as a proportion of total calorific intake) |
The results were first calculated by Classification of Individual Consumption by Purpose (COICOP) categories, then converted into Standard Industrial Classification (SIC) codes for input to UK TM. The following describes the mathematic construction of the food system model for each scenario and in creating the ambition pathways.
Calorific intake scenario
Calorific intake per capita in each age group (Ca) was calculated (in kilocalories), according to the standard variance of the GDR for each age group (CGDR a) from GDR adult intake (CGDR adult). Equation 1 applies this to average calorific intake (Cavg) to scale consumption to each age group. Annual average calorific intake (Cavg) is calculated logistically from the estimate of current calorific consumption in the Family Food Survey (Defra, 2018), accounting for underreporting, as well as the assumptions of change over time. The GDR values for CGDR a a and CGDR adult are fixed across the time series. Adult age groups are derived from the GDRs (PHE, 2016) and include: 15-64, 65-74, and 75+.
1) C_a= C_avg ∙ (1+(C_(GDR a)-C_(GDR adult))/C_(GDR adult)
To assess calorific intake on a product basis, annual calorific intake at the population scale (Cpop) was first calculated using equation 2, where the total population data (P) derived from ONS (2019) is multiplied by the sum for each age group of the proportion of the population of each age category (ρa) multiplied by the calories consumed per capita in this age group (Ca) as in equation 1.
2) Cpop = P ∑aρa ∙ Ca
Dietary shifts scenario
For each food group (f), equation 3 is used to calculate the total calories of this food group consumed in a given year across the population (Cf). The total calories consumed in the year (Cpop) is multiplied by the sum for each diet of the proportion of the population following the diet (ρd) multiplied by the proportion of calories in this diet that are supplied by the given food group (ffd).
3) Cf = Cpop ∑dρd ∙ ffd
Food waste reduction scenario
To calculate total calorific demand incorporating additional demand for calories from food waste per food group, equation 4 was used. Total demand for calories per food group per annum at the population scale (Df) was calculated by multiplying the total calories of a food group consumed in a given year across the population (Cf) by the rate of food waste per food group (Wf).
4) Df = (Cf ∙ (1 + Wf ))
Integrating the scenarios to ambition pathways
To combine the scenarios, the time series of calorific intake change (based on the assumptions outlined above) were linked to population estimates (weighted by age and total population projections). The population-based calorific intake time series were then applied to the diet scenarios, by multiplying the percentage of calories for each food group in the average UK diet against the absolute population-weighted calorie time series (Figure 5).
The time series of additional calorific demand from food waste were then used as a multiplier against the diet and population-weighted calorie values.
The 2017 UK expenditure by COICOP group was divided by the total UK per annum calories to produce a calorie intensity of spend (£/kcal). This constant intensity value was multiplied by the various calorie time series to produce time series of UK expenditure on food. A conversion factor of calorific intensity of spend (Mf; £/kcal) was created to mediate between the economic IO data and values for final calorific demand. This was achieved by dividing total annual expenditure per food group in 2017 (Xf; £m) by Df (equation 4).
The expenditure time series was converted to GHG emissions (kgCO2e) using emissions intensity of spend (kgCO2e/£ intensity) data as derived from the MRIO framework.
To calculate territorial emissions, equation 5 was used, where emissions (ET) are the sum for each food group (f) of the total calorific demand (including waste, Df), and converted to expenditure (Mf). This is then multiplied by the carbon intensity of UK consumption (Gd f). Expenditure is calculated for each year based on the Mf factor and calorie time series.
5) ET = ∑f Df ∙ Mf ∙ Gd f
Emissions time series for GHG, CO2, N2O and CH4 gases were similarly calculated using specific conversion factors from the IO source data. The emissions time series (in COICOP) were converted to SIC codes by using a proportional allocation approach – that is, for each food product the fraction of global impacts occurring in each UK sector was calculated, and multiplied by the emissions resulting from UK consumption of that food group. To calculate total impact per year per sector, the impacts of each food group were summed. This also allocated the impact of UK expenditure on food to the impacts occurring in the UK sectors only.
To calculate the impacts of UK food exports, a scenario was run where only food waste reduction in the upstream supply chain stages occurs (e.g. from farm to distribution), and scaled to the percentage of products exported by each SIC sector. This presupposes that the rate of export from the UK per food-related SIC sector remains constant throughout the time series. The results for UK production for UK demand and UK production for export were combined to provide a single estimate for total UK production.
The results were then restricted to impacts in the food specific SIC sectors and indexed against a 2017 baseline.
Results
[based on results from 20.07.20]
| SIC sector | Percentage reduction against baseline (2017) GHG emissions in 2050 at each ambition level | |||
|---|---|---|---|---|
| Constant | Base | Low | High | |
| Agriculture | 6.26 | -15.69 | -27.39 | -35.86 |
| F&D (sum of F&D industrial sectors) | 5.17 | -0.74 | -9.12 | -14.05 |
References
Allès, B., Baudry, J., Méjean, C., Touvier, M., Péneau, S., Hercberg, S., Kesse-Guyot, E., 2017. Comparison of Sociodemographic and Nutritional characteristics between self-reported vegetarians, vegans, and meat-eaters from the NutriNet-Santé Study. Nutrients, 9: 1023. doi: 10.3390/nu9091023
Audsley, E., Brander, M., Chatterton, J., Murphy-Bokern, D., Webster, D. and Williams, A. 2010. How low can we go? An assessment of greenhouse gas emissions from the UK food system and the scope to reduce them by 2050, pdf. London: WWF- UK.
Bajželj, B., Richards, K.S., Allwood, J.M., Smith, P., Dennis, J.S., Curmi, E. and Gilligan, C.A. 2014. Importance of food-demand management for climate mitigation. Nature Climate Change, 4 (10): 924–929. doi: 10.1038/nclimate2353
BEIS (Department for Business Energy and Industrial Strategy), 2019. Updated energy and emissions projections: 2018. London: Crown Copyright.
Bradbury, K.E., Tong, T.Y.N., Key, T.J., 2017. Dietary intake of high-protein foods and other major foods in meat-eaters, poultry-eaters, fish-eaters, vegetarians, and vegans in UK Biobank. Nutrients, 9: 1317. doi: doi.org/10.3390/nu9121317
Bryngelsson, D., Wirsenius, S., Hedenus, F. and Sonesson, U. 2016. How can the EU climate targets be met? A combined analysis of technological and demand-side changes in food and agriculture. Food Policy. 59: 152–164. doi: 10.1016/j.foodpol.2015.12.012
Caldeira, C., de Laurentiis, V., Corrado, S., van Holsteijn, F. and Sala, S. 2019. Quantification of food waste per product group along the food supply chain in the European Union: a mass flow analysis. Resources, Conservation and Recycling, 149: 479–88. doi: 10.1016/j.resconrec.2019.06.011
Chalmers, N., Revoredo-Giha, C. and Shackley, S. 2016. Socioeconomic effects of reducing household carbon footprints through meat consumption taxes. Journal of Food Products Marketing, 22 (2): 258–77. doi: 10.1080/10454446.2015.1048024
CCC (Climate Change Committee), 2018. Land use: Reducing emissions and preparing for climate change. London: Committee on Climate Change.
CCC, 2019. Net Zero: The UK’s contribution to stopping global warming. London: Committee on Climate Change.
CCC, 2019. Reducing UK emissions: 2019 Progress Report to Parliament. London: Committee on Climate Change.
Creutzig, F., Roy, J., Lamb, W.F., Azevedo, I.M.L., Bruine De Bruin, W., Dalkmann, H., Edelenbosch, O.Y., Geels, F.W., Grubler, A., Hepburn, C., Hertwich, E.G., Khosla, R., Mattauch, L., Minx, J.C., Ramakrishnan, A., Rao, N.D., Steinberger, J.K., Tavoni, M., Ürge-Vorsatz, D. and Weber, E.U. 2018. Towards demand-side solutions for mitigating climate change. Nature Climate Change, 8 (4): 268–271. doi: 10.1038/s41558-018-0121-1
Defra (Department for Environment Food and Rural Affairs), 2018. Family food 2016/17: UK household purchases. London: Crown Copyright.
DECC and BEIS (Department of Energy and Climate Change, and the Department for Business Innovation and Skills), 2015. Industrial decarbonisation & energy efficiency roadmaps to 2050: Food and drink, pdf. London. London: Crown Copyright.
FAO (Food and Agriculture Organization), 2020. FAOSTAT – New food balances. Rome: Food and Agriculture Organization of the United Nations.
Garnett, T. 2009. Livestock-related greenhouse gas emissions: impacts and options for policy makers. Environmental Science and Policy, 12(4): 491–503. doi: 10.1016/j.envsci.2009.01.006
Godfray, H.C.J., Aveyard, P., Garnett, T., Hall, J.W., Key, T.J., Lorimer, J., Pierrehumbert, R.T., Scarborough, P., Springmann, M. and Jebb, S.A. 2018. Meat consumption, health and the environment. Science, 361 (6399): 5324. doi: 10.1126/science.aam5324
Godwin, R. 2019. The vegan halo: How plant-based products are transforming British brands. London: The Guardian.
Grabs, J. 2015. The rebound effects of switching to vegetarianism. A microeconomic analysis of Swedish consumption behavior. Ecological Economics, 116: 270–279. doi: 10.1016/j.ecolecon.2015.04.030
Haddad, E.H., Tanzman, J.S., 2003. What do vegetarians in the United States eat? The American Journal of Clinical Nutrition, 78: 626–32. doi: 10.1093/ajcn/78.3.626S
Hammond, G.P. 2018. Sector Analysis of industrial energy, pdf. Leeds: Centre for Industrial Energy, Materials and Products.
Hancox, D., 2018. The unstoppable rise of veganism: How a fringe movement went mainstream. London: The Guardian.
Harper, H., Hallsworth, M., 2016. Counting Calories: How under-reporting can explain the apparent fall in calorie intake. London: The Behavioural Insights Team.
HM Government 2018. Our waste, our resources: A strategy for England. London: Crown Copyright.
Ipsos MORI 2016. Vegan Society Poll Ipsos MORI.
Jones, L. 2018. Veganism: Why is it on the up? BBC News.
Mills, S. and Wright, T. 2015. Access to food retail outlets in County Durham, UK: a pragmatic cross-sectional study. The Lancet, 385 (Supplement 1): S70. doi: 10.1016/S0140-6736(15)60385-3
NHS Digital 2018. Health Survey for England 2017. Leeds: NHS Digital.
ONS (Office for National Statistics), 2019. Dataset: Estimates of the population for the UK, England and Wales, Scotland and Northern Ireland. London: Office for National Statistics.
PHE (Public Health England), 2017. Health matters: Obesity and the food environment. London: Crown Copyright.
PHE, 2016. Government Dietary Recommendations: Government recommendations for food energy and nutrients for males and females aged 1 – 18 years and 19+ years, pdf. London: Crown Copyright.
PHE, 2018. The Eatwell Guide. London: Crown Copyright.
PHE, 2019. National Diet and Nutrition Survey: Years 1 to 9 of the Rolling Programme (2008/2009-2016/2017): Time trend and income analyses. London: Crown Copyright.
Smith, P., Bustamante, M., Ahammad, H., Clark, H., Dong, H., Elsiddig, E. et al. 2014. Agriculture, forestry and other land use (AFOLU). In: Climate Change 2014: Mitigation of Climate Change Contribution of Working Group III to the Fifth Assessment Report of the Intergovernmental Panel on Climate Change. Chapter 11, page 811‐922. Cambridge: Cambridge University Press.
Stehfest, E., Bouwman, L., Vuuren, D.P. van, Elzen, M.G.J. den, Eickhout, B. and Kabat, P. 2009. Climate benefits of changing diet. Climatic Change, 95(1): 83–102. doi: 10.1007/s10584-008-9534-6
The Vegan Society 2019. Statistics – The Vegan Society. Birmingham: The Vegan Society.
Tong, T.Y.N., Imamura, F., Monsivais, P., Brage, S., Griffin, S.J., Wareham, N.J. and Forouhi, N.G. 2018. Dietary cost associated with adherence to the Mediterranean diet, and its variation by socio-economic factors in the UK Fenland Study. British Journal of Nutrition, 119 (6): 685–94. doi: 10.1017/S0007114517003993
United Nations, 2019. Sustainable Development Goal 2. New York: United Nations.
Waitrose & Partners 2019. Food and Drink Report 2018-19. Bracknell, UK: Waitrose & Partners.
Willett, W., Rockström, J., Loken, B., Springmann, M., Lang, T., Vermeulen, S.et al. 2019. Food in the Anthropocene: the EAT-Lancet Commission on healthy diets from sustainable food systems. Lancet, 393 (10170): 447–492. doi: 10.1016/S0140-6736(18)31788-4
WRAP 2018. Household food waste: restated data for 2007-2015. Banbury: WRAP.
YouGov UK, 2017. YouGov / Eating Better Survey Results, pdf. London: YouGov UK.
Citation
Garvey, A. and Norman, J. 2021. The role of energy demand reduction in achieving net-zero in the UK: Nutrition. Centre for Research into Energy Demand Solutions. Oxford, UK.