
Mobility
Reading time: 66 minutes
Christian Brand, Jillian Anable and Greg Marsden
Background
The black sheep of energy
The transport sector continues to have a significant dependence on oil, with a share of 95% of all global transport energy use in 2015, and this has not changed since the 1970s (IEA, 2018). In the UK, road transport accounted for just under three quarters of transport energy consumption in the UK in 2017, with the remainder almost entirely from air travel (23%). Of the road component, energy use from cars accounts for more than half (60%), with most of the remainder coming from ‘light duty vehicles’ (vans) (16%), heavy goods vehicles (HGVs) (17%) and buses (3%) (BEIS, 2019). Energy use from transport has increased by 16% since 1990 (6% since 2013) against a UK economy-wide decrease of 4% (CCC, 2018; BEIS, 2018) and remains 98% dependent on fossil fuels. It has grown as a share of overall carbon emissions with no net reduction between 1990-2017 (vis-à-vis –43% for all sectors combined).
The response so far
The primary focus of UK policy has been to change the vehicle fleet from petrol and diesel, first to ultra low emission vehicles (ULEVs), and then to zero-emission vehicles (ZEVs) (ULEVs produce < 75 g/km CO2 under the existing test cycle and includes pure Battery electric vehicles (BEVs), Plug-in hybrid electric vehicles (PHEVs). Zero emission vehicles emit no carbon or pollution from the tailpipe and include BEVs and Fuel cell vehicles. Strictly these are only zero emission when powered by renewable or zero emission electricity (DfT (2018a)), primarily through electrification. A lack of progress with heavy goods vehicles and aviation persists, but the unexpected change is the increase in new car energy consumption and CO2 (SMMT, 2018). Switching from diesel accounts for a small proportion of this increase; the main culprit is a continued swing towards larger passenger cars, particularly Sports Utility Vehicles (SUV), which use about 15% more energy than their hatchback or sedan equivalents. Electric vehicles accounted for 8.8% of sales in 2020 (up from 2.5% in 2019) (SMMT, 2020), with two out of five sold being plug-in hybrid electric vehicles (PHEVs). PHEVs have shown to perform little better in terms of energy use and carbon emissions than the most efficient conventional ICE vehicles in real world conditions, as they have been shown to operate in electric mode for only a third of the miles travelled (Plötz et al, 2018a; Plötz et al, 2018b; Plötz et al, 2020). This gap between declared vehicle performance and real-world results prevails across all vehicle types and technologies.
For new cars, fleet average test cycle data suggest a 30% reduction in tailpipe CO2 since 2000. In practice, there has only been an estimated 9% reduction in tailpipe emissions in real-world conditions, and only 4% since 2010. The ‘performance gap’ between official and real-world values grew over time, peaking at 40% in 2016 (NEDC test cycle). This gap has effectively negated any reported savings from efficiency improvements over the past decade.
What about transport after Covid-19?
Car traffic levels returned to around 85% of pre-Covid levels in September, whilst bus use was at 60% and rail 30% of pre-Covid levels. Light and heavy goods vehicles were above pre-Covid levels giving an overall reduction in traffic levels of 10%. This is dropping a little further as areas enter further levels of restriction. Cycling levels more than doubled during the peak lockdown restrictions but most of this appears to have been leisure related travel and is falling back as the autumn draws on.
The recovery from Covid-19 has a number of uncertainties for transport. Economic recovery means doing more stuff, which may mean more mobility. There are parts of the economy which have not fully re-opened yet. On the road to recovery, fewer local jobs means travelling further to find work. Less flying abroad means more staycationing and domestic travel demand – an effect of the pandemic that features prominently in the LED scenarios. Having a ‘civic duty’ to not use public transport, a mode already in decline Before Covid-19 (‘BC’), means more use of other modes instead. Work has suggested that a plausible best case for bus use might be reaching 85% of pre-pandemic levels (UTG, 2020). For some people, this could mean resorting to buying a (more polluting second hand) car. Others may not see the need to hold on to so many vehicles if they travel less often.
Homeworking rarely leads to lower net energy demand (Hook et al, 2020). More energy is used at home (rarely countered by equivalent reductions in office space and energy use) and people move to live further from where they work because now they can. And the businesses themselves expand their source of workers and their geographical sphere of activity as ICT becomes integrated and synonymous with evolving business practices (Faulconbridge et al, 2020). However, the scale of the shift in ICT reconfiguration associated with Covid-19 may produce different outcomes if travelling into work on many fewer days a week sticks.
The recession may well lead to an extended dip in car use as we have seen historically during such times. However, previous recessions have not been accompanied by a crisis in public transport use. It is also plausible that we will see more cycling AND more car use. It is therefore also possible that the transport sector could return to being the only UK sector other than agriculture and land-use change to have higher emissions now than in 1990. Overall, the pandemic seems to have changed little with respect to the priorities that existed beforehand. Capitalising on the positive aspects of demand reduction which have been seen is at best mixed. National government has been keen to “get people moving” although businesses have been more circumspect. Whilst a positive new cycling strategy has been published it does not come with new money and the Road Investment Strategy 2’s (RIS2) roads programme remains a commitment (DfT, 2020). It appears that the primary push will continue to be to accelerate electrification despite an understanding that this will not be sufficient to be Paris compliant.
What else can be done?
This almost universal focus on improving energy consumption per passenger-km or tonne-km travelled ignores the other two core elements of the Avoid-Shift-Improve hierarchy of avoiding travel in the first place (trip reduction due to change in activity) and shifting travel to more sustainable modes (reduction in energy use per passenger-km or tonne-km travelled) (Schipper and Marie-Liliu, 1999; EEA, 2011; Gota et al, 2019). This hierarchy has been used to emphasise the priority ordering and layering of our scenarios that stand apart from the dominant supply and vehicle technology-oriented approach to energy reduction and decarbonisation in the sector. Our scenarios thus reinforce the growing consensus that relying on technical solutions alone is insufficiently rapid and risky, and that policies influencing the demand for travel and mode switching should have a more prominent role (CCC, 2018; CCC, 2019). Here the demand for the mobility itself (i.e. the distances travelled and the travel modes used) will be at least as crucial to future energy demands as the fuel types and efficiencies of the vehicles.
The drivers and prospects for travel demand change
Since the early 1990s (but only now being retrospectively understood), actual road traffic growth has been systematically less than forecast so that the hitherto uninterrupted growth in car use is no longer the dominant trend. Periodic discussion of ‘peak car’ has led into investigations of the evidence (Marsden et al, 2018; Melia et al, 2018), which reveal that structural changes in travel demand due to shifts in the pattern and location of activities, social changes including delayed family formation, economic changes in the nature of retail and employment (especially youth employment), and possible impacts of mobile internet access, all correlate with a downward trend in overall trip rates and distances travelled.
These trends are manifesting differently among different groups and in different locations; only an aging cohort of people, now over 60, has contributed to traffic growth, while successive cohorts of younger people have shown a reduction in driving license holding, car ownership, and car use (DfT, 2018a). The largest reductions in per capita distances travelled by car have been in the two highest income quintiles (CCC, 2018).
Such findings sit alongside a very substantial body of experience and evidence about the effects of policy interventions intended to address a much wider range of policy objectives than energy use alone, including health, quality of life, commercial vitality, safety, and equity. These various objectives have all tended to converge on policy packages aimed at reducing the need to travel by better land-use planning, restrictions on car use in central, residential, and environmentally sensitive locations, and facilitating transfer of car trips to public transport, walking and cycling by reallocation of expenditures, street design, pricing and regulation. This allows for a policy perspective where reduced energy use does not run counter to quality of life but arises from measures designed to enhance it. Conversely, relying mainly on electrification of vehicles to reach carbon targets can have the consequence of increasing traffic congestion because of the lower cost and lower taxation of electric fuel (as much as an additional 44bn vehicle miles per year by 2050) (DfT, 2018b).
Thus, the pattern of co-benefits, empirical evidence on trend shifts and policy implantation, and better understanding of influences on demand, give scope for considerably more ambitious reductions in passenger transport energy and carbon use than have been assumed in much of the UK policy response to date (DfT Road to Zero, Clean Growth Strategy, CCC). Moreover, evidence suggests a lower rate of demand for passenger mobility is a necessary and a credible future, but that this would require a different policy package to ‘scale up’ and ‘lock in’ the new demand patterns, alongside new vehicle technology.
The drivers considered for the Low Energy Demand scenarios
National and international examples of sustained lower car dependent lifestyles indicate that this can be achieved at least in some localities. Such a prospect puts much greater emphasis on policies which influence and provide for more energy conserving lifestyles, including: emerging models of car ‘usership’, changing social norms around mobility, new spatial patterns of population growth, the changing nature and location of work, education, housing, healthcare and leisure, reconfiguration of travel by digital technology, and new ways of paying for road use or energy (electricity). Here, the said Avoid-Shift-Improve hierarchy (Schipper and Marie-Liliu, 1999; EEA, 2011; Gota et al, 2019) has been used to emphasise the priority ordering and layering of our scenario storyline that stand apart from the dominant supply and vehicle technology-oriented approach to energy reduction and decarbonisation in the sector.
As strategies to avoid travel demand and car ownership, we consider ways to ‘lock-in’ recent demand changes, new regulatory frameworks to steer emergent transport innovations, the promotion of car clubs and freight consolidation centres, and coordination of transport and planning objectives to reduce the need to travel people (e.g. tele-shopping) and goods (e.g. localisation of food shopping). For each of these measures we assessed the likely effects on trip rates for different journey purposes and trip lengths in the medium (2030) and longer (2050) term.
Policies such as car clubs, smart ticketing, investment in rail and in digital technology have shown to reduce travel demand and car ownership in some groups, and the scenarios extend the behaviours to other groups of society. Having access to a shared vehicle has been shown to lead to reductions in personal car ownership and miles driven, as well as increased use of other modes of transport (Marsden et al, 2018). This reduction includes households giving up a car completely, but equally important is reducing from, say, two cars to one car. Support options in a LED world take the form of both carrots (e.g. supporting interoperable underpinning ICT infrastructure, ‘smart’ design of car scrappage, integrating shared travel into multi-modal journey-planning apps, providing dedicated car parking, charging and signage to car club vehicles) and sticks (e.g. parking charges and restrictions in residential areas and workplaces for privately owned vehicles). Access to subsidised or free public transport is at present largely determined by age, and it is clear that behaviour patterns also show strong age effects but making best use of this may justify an overall review of age boundaries both for the young and old. Improving the experience for these sub-groups of living without a car should not only improve the chances of them opting to live without one (or with fewer per household than they might have done) for longer, but will simultaneously improve non-car travel for a wider set of people and places.
To avoid ‘induced travel’ from emerging innovations (Fulton 2018) such as mobility as a service (MaaS), autonomous and connected vehicles (ACV) and artificial intelligence (AI), we assume a ‘preventative’ regulatory framework designed to ensure these innovations result in a net increase in co-benefits such as social inclusion and transport and energy system flexibility is in place. Specific interventions such as mandating the use of autonomous vehicles in shared contexts, public investment in car-clubs or MaaS in rural areas and designing car scrappage schemes to accelerate the uptake of mobility packages as opposed to new vehicles, are necessary and key parts of the LED scenario mix.
Enabling travel avoidance is chiefly a matter of coordination of planning and transport objectives in the housing type and location, density of development and location. It involves innovation at workplaces, as well as the timing and management of access to services (including schools and healthcare). Often considered longer term options, the recent demand changes due to CV19 have shown that travel avoidance can happen fast, further and more flexibly now. Finally, the LED scenarios assume a stop to new road building because travel demand falls – instead, existing roads are maintained and repurposed when it makes sense to do so, e.g. low traffic neighbourhoods and ‘superblocks’ (Mueller et al, 2020).
As strategies to shift travel to the most sustainable modes, we consider systematic support for the very lowest energy modes of transport and restraint for the highest energy modes. This is supported by a new approach to prices and taxes to reflect a fuller range of costs and benefits.
Enabling and encouraging a shift from private motorised travel to more energy efficient modes requires systematic support for the very lowest energy methods of transport – walking, cycling (including e-bikes and e-scooters) and public transport, through investment programmes on both capital and revenue spending, priority use of road space, an expansion of ‘soft’ or ‘smarter’ methods of encouraging behavioural change. The strategic goal is to design “a mobility system where it is more normal to take part in activities using the most sustainable modes more of the time” (Marsden et al, 2016).
The new approach to transport pricing would ensure that the relative prices of different transport options reflect the full range of costs and benefits to the consumer, including health, energy, embedded emissions, congestion and other environmental impacts. Restructuring prices include direct subsidy to lock in sustainable travel choices by charging for use of scarce resources at a rising unit rate where more is used. Such pricing mechanisms would therefore expand the traditional notion of road user charging to reflect wider transport and energy system usage and will incorporate thinking on how to avoid increases in demand that may be stimulated by lower motoring costs of electric vehicles.
As strategies to improve the efficiencies of individual modes, we consider improving the efficiency of vehicles in use, particularly through increased occupancy, restructuring ULEV targets to include phasing out hybrid electric cars by 2030, and regulation to reduce the availability and sales of ‘large’ cars.
While a comprehensive and sustained eco-driving programme (as in the Netherlands) is part of the LED scenario mix, a focus on efficiency of vehicles in use is much more than that. It considers maximising assets in ways that substantially reduces single car occupancy and individual ownership. There is no detectable policy weight placed on the efficiency of vehicles ‘in use’ even though increasing vehicle occupancy, potentially through mobility sharing platforms, would ratchet down energy intensity of travel considerably. There are a number of potential types of initiative targeting both businesses and individuals, again falling in to ‘carrot’ (mileage fee reimbursement rates and salary sacrifice incentives) and ‘stick’ (regulation of the use of own cars on business travel, parking restrictions and fees) as well as a review of company carbon accounting to incorporate commuting travel.
Much of the evidence now suggests that the trajectory for urgent CO2 savings to achieve ‘net-zero’ requires phasing out all forms of conventionally fuelled internal combustion engine (ICE) and hybrid electric vehicle (HEV) cars and vans by 2030 (CCC, 2018; Brand et al, 2020). Furthermore, to counter the trend towards ownership and use of larger cars, the LED scenarios involve regulating to phase out the largest vehicles in advance of the above ULEV target or restrict their use to genuinely appropriate circumstances (Brand et al, 2020b).
Evidence and assumptions
Scenario storylines including socio-technical developments and policy measures
BAU scenario
- Projection of transport demand, supply, energy use and emissions as if there were no changes to existing transport and energy policy.
- Ageing population – BAU takes into account changes to trip rates and distance travelled of an ageing population. For instance, an older person makes very few work or education trips – just 24 trips per person per annum on average, less than 3% of their total annual trips. Retired people initially tend to make more leisure trips, but as they become older and disabilities intervene, trip making tails off. National Travel Survey data show there was a decline in the average number of shopping trips per capita until recently (from 230 trips to 189 trips since 1995/98 =18% in 20 years but only 1% in past 5 years). The recent slowdown is likely related to the fact that there has been a major uptick in short journeys for all purposes. However, distance travelled for shopping has not increased.
- Phase out sale of conventional fossil fuel cars and vans by 2040. Consumers increasingly shy away from diesels post ‘Dieselgate’ (Brand 2016). Existing UK plug-in vehicle grant (OLEV 2018) for cars, vans, taxis and motorcycles (up to £3,500 for cars, depending on how ‘plugged-in’ the vehicle is) to ‘phase out’ by the late 2020s. Consumer awareness of EVs increases to ~50% by mid 2020s then levels out. Certainty of access to charging for fleet operations stays at 40%. Private access to overnight charging level at 70%. See Brand et al (2019) for the full set of assumptions of the BAU scenarios.
Shift demand and Transform demand scenarios
Core elements of the storylines
- No more steady incremental changes in travel patterns – Rapid action to reduce private car use will be ‘just’ if paralleled by big increases in supply of alternatives (shared mobility, public transport, active travel including e-bikes and other micro e-mobility).
- Gradual/rapid change in travel patterns, mode choice and occupancy levels leading to relatively fast transformations and new demand trajectories.
- Concerns relating to health, quality of life, energy use and environmental implications drive social change. Triggered by ‘worsening conditions’ (climate change, pandemic(s), economic downturn), social norms promote status of more sustainable modes of transport and low traffic neighbourhoods and demote single-occupancy car travel, fossil fuelled vehicles, unnecessarily long distances and speeding.
- ICT facilitates rapid behavioural change by making cost and energy use transparent to users, changing everything from destination choice, substitution of shopping and personal business trips by home delivery, car choice and models of ‘ownership’, driving style and paying for travel, including in the freight sector.
- Renewed focus on localism and ‘proximity principle’ in planning – e.g. local shopping, local schools, local leisure travel.
- Changes in work patterns and business travel fuelled by renewed emphasis on quality of life but also facilitated by increasingly sophisticated ways of substituting disproportionally impactful long commuting and business trips by digital technology.
- Increased internet shopping increases the use of vans, which somewhat offsets the positive effects of decongestion from fewer cars on the road.
- International aviation and shipping included in domestic carbon budget. No use of offsets. But #flyingless = more domestic surface leisure and business travel.
- Fastest reductions achieved by passenger travel to compensate for challenges with freight decarbonisation (HGVs) and travel reduction (hard to decouple from economic activity).
- Much more radical market transformation of passenger vehicle fleet than currently assumed as it will include rapid phase out of sale of high-polluting vehicles.
- Autonomous vehicles by 2050 only in niche local applications and some long distance fixed routes. Limited impact.
Socio-economic and structural factors (largely external to the transport sector)
- “Non-transport transport factors” (e.g. wider socio-technical and policy shifts) will be as important as transport specific technology and policy change.
- Structure of labour market will result in significant changes to commuting: service and gig economy (=increase), and introduction of a four day working week (=reduction) (Transform demand scenario)
- Changes to structure of retail – retail and leisure blend together as more ‘mundane’ shopping is done online but coffee and experience = local leisure
- Businesses are made much more accountable for their emissions (including commuting)
- Devolution/ localisation – changes to planning system and desire to work and play more locally
Social norms change: single occupancy car use, large cars and flying less acceptable (much less in Transform demand scenario) - Public acceptance for new regime of ‘pay as you go’ pricing linked to environmental impacts
- Pricing of aviation (esp. frequent fliers) becomes acceptable during the 2020s
Transport policies
- No more road building or airport capacity expansion; some roads repurposed for shared, public and active mobility
- No more development on greenfield sites (consistent with the ‘no new homes’ scenario)
- Integrated transport authorities in all urban/city regions (One network; One timetable; One ticket)
- Re-regulation of buses and railway under public control
- Doubling investment in public transport, walking and cycling – including e-bikes and on-demand services enabled by ICT
- Construction of high-quality cycling networks of segregated cycleways in all urban areas and along all single carriageway roads radiating within e-bike range (about 15km) from major settlements
- Single occupancy car use becoming socially unacceptable and parking charges and infrastructure designed to encourage vehicle sharing
- Eventually, no cars in centre of many urban areas
- Eco-levy applied to the whole system – the more you travel and the more polluting modes you use, the more you pay – includes air travel (frequent flier levy)
- Car fleet is reduced substantially as driving licence uptake is down with transition to ‘car usership’
- But taxi and shared fleets increase – all electric by 2030
- Increase in LCV (van) fleet due to more online shopping – electric only sold from 2030
- Fossil fuel ICE cars (not vans) banned from urban centres by 2030; all cars banned by 2035
- Large and heavy ICE, PHEV and HEV cars gradually phased out in 2020s; only BEVs (for cars and vans) from 2030 (2025 in Transform demand case)
- High taxation on more than one car per household
- Substantially expanded bus fleet will be largely electric (but not all – coach, mini)
- Big investment in and standardisation of charging infrastructure across the nation
- HGV – renewed push for consolidation centres around big cities and towns – reduced miles travelled
- Road freight – much improved logistics, vertical integration eg Amazon – improves load factors for long and medium distance freight
- No significant shift from road to rail freight as rail capacity is largely taken up by net passenger rail increases (leisure up more than commuting and business down)
- Last mile delivery regulated to require zero emission vans or e-cargo bikes
Key assumptions, evidence and justification
1. Travel demand (AVOID)
| Type | Shift | Transform | Comment/source | ||
|---|---|---|---|---|---|
| 2030 | 2050 | 2030 | 2050 | ||
| Commuting, reduction due to more in retirement | 0% | 5% | 0% | 5% | Proportion in working age or pensionable age will not increase substantially by 2030 (as pension age goes up) but the ratio does change by 2045 so that avg. number of working trips per person by then will go down. Of course, poorer pensions by then could mean that people would have to work into older age, but we have not assumed this. |
| Commuting, reduction due to working at home or teleworking | 4% | 7.5% | 7.5% | 13.5% | Industrial restructuring will have more impact on commuting than any policy, including telecommuting. The uptake in teleworking is reinforced by tax incentives, travel plans, gigabit/5G broadband-roll-out (by 2028 in HA, 2024 in TR), and road user charges and parking charges. |
| Commuting, increase due to gig and service economy | 5% | 15% | 5% | 15% | There are expectations that many more contingent and freelance workers will replace full time jobs, thus increasing trip rates per worker. (See trend data and evidence below.) |
| Commuting, reduction due to 4-day week | 0% | 0% | 10% | 15% | Only in Transform demand scenario: half of sectors introduce a 4-day week by 2030 (10% reduction in trips) and a further quarter by 2050 (15% reduction in trips). |
| Business travel, reduction due to more in retirement | 0% | 5% | 0% | 5% | Same as for commuting (see above) |
| Business travel, reduction due to tele/video conferencing | 10% | 20% | 15% | 30% | As the pandemic has shown tele/video conferencing can reduce business trips immediately. We extrapolate existing evidence (Cairns et al 2004; Cairns et al 2008; Scottish Government 2013) on this to reach 30% maximum reduction in trips by 2050 in the Transform demand scenario, on the basis that there are many business trips e.g. nursing which cannot and simply will not be avoided over long periods of time. Reductions also apply to air trips. |
| School travel, decrease due to ageing population | 5% | 5% | 5% | 5% | Older people make fewer school/education and escort education trips. |
| Shopping, increase due to more people in retirement | 0% | 5% | 0% | 5% | More shopping trips replace commuting and business trips in the 2040s |
| Shopping, reduction due to combining with commuting & leisure travel | 10% | 15% | 15% | 20% | More pass by shopping on commute will reduce bespoke food shopping trips (these are recorded as commuting). |
| Shopping, reduction due to teleshopping | 10% | 20% | 15% | 25% | Going Smarter report33 suggests that home shopping could reduce vehicle mileage for shopping by 4% after 10 years. Here we assume further reduction as teleshopping continues to become normal for some goods with direct substitution. More pass-by shopping on commute will also reduce food shopping trips (captured under Commuting). |
| Personal business, increase due to more people in retirement | 5% | 10% | 5% | 10% | Gradual increase in frequency of personal business trips due to ageing population. |
| Personal business, decrease due to tele-activity | 10% | 15% | 15% | 20% | Move to access some services such as banking and medical care on-line. Increased accessibility and usability of ICT will lead to some net reduction. |
| Local leisure, increase due to ageing population | 0% | 5% | 0% | 5% | Gradual increase in frequency of local leisure trips (social entertainment, sports, visiting friends and family not at their home ) due to ageing population. |
| Local leisure, increase due to shift to more local trips | 10% | 10% | 10% | 15% | There is a general shift in all age groups towards more local leisure trips for at the expense of longer trips, so a modest increase is assumed. |
| Local leisure, increase due to blending of shopping & leisure | 5% | 10% | 5% | 10% | There is some growth in trips as some shopping are more akin to local leisure (e.g. coffee and browse), so we will see local leisure trips increase somewhat. |
| Distance leisure, increase due to ageing population | 0% | 5% | 0% | 5% | Only later in period, we see an increase in frequency of long distance leisure trips due to ageing population. |
| Distance leisure, increase due to holidaying at home | 10% | 15% | 15% | 17% | Fewer people travelling abroad means more domestic holidays. |
| Type | Shift | Transform | Comment/source | ||
|---|---|---|---|---|---|
| 2030 | 2050 | 2030 | 2050 | ||
| Commuting, reduction due to more tele and hub working | 10% | 20% | 15% | 25% | Teleworking abstracts the longer commute trips and therefore has a disproportionately large impact on average trips lengths, particularly in the Transform demand scenario. Policy measures lock in that reduction. |
| Commuting, reduction due to proximity principle | 3% | 10% | 5% | 15% | The proximity principle assumes that there is a movement towards living closer to work places and other services |
| Commuting, increase due to gig economy | 5% | 5% | 5% | 5% | Longer trip distances due to more widely dispersed gig economy and ‘opportunity’ to live further away from work |
| Business travel, reduction due to more tele/video conferencing | 10% | 20% | 15% | 25% | Assumed that the longest business trips are increasingly substituted by tele/video conferencing. |
| Business travel, increase due to less air travel | 5% | 5% | 5% | 8% | Some domestic air travel for business shifts to rail, which slightly increases trip distances |
| School travel, reduction due to school selection policy | 10% | 15% | 15% | 25% | School selection policy is revised to insist that neighbourhood schools are chosen, esp. for secondary schools (reversal of Education Act, 1988) |
| Shopping, reduction due to more e-shopping and local shopping | 10% | 10% | 15% | 15% | Restriction of cars in urban areas means that shorter, local journeys become more attractive. Also more e-shopping replaces longer trips. There are limits though as not all cities and population segments are on board. |
| Personal business, reduction due to more e-shopping and local shopping | 5% | 10% | 10% | 15% | Restriction of cars in urban areas means that shorter, local journeys become more attractive. E-services replace some (longer) trips. |
| Local leisure, reduction due to switch to active travel | 5% | 10% | 10% | 15% | Assuming leisure time budgets do not increase significantly, so gradual shift towards ‘slow modes’ of walking, cycling and e-biking around the local area reduces average trip lengths. |
| Long distance leisure, increase due to substitution for trips abroad | 5% | 10% | 5% | 10% | There are fewer day trips and more people cycling and walking from home, but some longer holiday trips (weekends away) to replace travel abroad – on balance average distance increases somewhat. |
| Other trips, reduction due to proximity principle | 5% | 10% | 10% | 15% | Re-introduction of local services, especially in rural areas. Restriction of cars in urban areas means that shorter, local journeys become more attractive. |
Travel to work and potential for tele-commuting
- People in England are making fewer trips to the usual place of work and only a small part of this is about telecommuting (Vine et al, 2017).Working at home has gone up very slowly, but working in different places on different days has gone up. What is clear is that there has been a 10% drop in the number of people reporting working at the same place, out of home every day. In terms of types of work performed (SEG), ‘Professionals’ were the most likely to work at home occasionally (in 2008 16% reported doing so), followed by ‘Employers/Managers’ (14%) and ‘Self-Employed Non-Professionals’ (8%). ‘Manual’ and ‘Personal Service’ workers were the least likely (at fewer than 1% each) (Vine et al, 2017).
- Twenty years ago, there was a widespread belief among commentators that the defining feature of the future UK labour market would be radically reduced working hours and increased leisure time (UKCES, 2014). In 2002, there were 2.2 million teleworkers in the UK – about 7.4% of the workforce 9ONS 2002). This is people who work at home at least one day per week. Between 2012 and 2016, flexi-time has risen by 12% (HSO, 2020). Data from the Office of National Statistics (ONS) on ‘whether people were working from home in their main job’ revealed that 14% were all home workers, 5% all those home workers who report they work from their own home or within the grounds of their home, and 8.6% home workers who report they meet clients and customers elsewhere but use their home as a base (ONS 2016). Some have suggested that thanks to changing attitudes and ever-improving network capabilities this number is expected to continue its upward trajectory, ‘with half the UK workforce expected to be working remotely by 2020’ (HSO, 2020).The ~50% share actually happened, but only temporarily and due to lockdown measures.
- Commuting as a Car Passenger has declined, with corresponding growth in use of National Rail and London Underground. However, car driving remains dominant, accounting for more than half of commuting journeys (Vine et al, 2017).Commuters are travelling further: average distances have increased. At the same time, the duration of commuting journeys has also been growing. These trends are primarily due to rapid changes in commuting behaviour by part-time workers (Vine et al, 2017).
- Banister et al (2007) showed that substantial energy savings are possible through working at home, particularly if no additional space heating is used at home or at the usual place of work. There will certainly be substantial energy savings in the summer when less space heating is necessary, but research is required on average use and changes resulting from working at home. The average figures presented by Banister et al. suggest that the savings are limited if additional energy is used, but that the threshold is for return journeys to work over 14 miles (22 kms).
- Industrial restructuring and/or a four day working week (Paul, 2019) may have a far bigger impact on future commuting travel demand trends than telecommuting. This has been reflected in the scenario assumptions on changes to commuting trip frequencies and distance travelled.
- Transport policy will require businesses to be made responsible for the commuting they generate (by mandatory inclusion of Scope 3 emissions in carbon reporting). This means that policies to work at home are improved and there is more systematic adoption of teleworking. In the Shift demand scenario, all companies are mandated to make their employees to work at home at least one day per week (for those types of jobs that are compatible for tele-working). Local authorities are all introducing pricing policies which reinforce desire for some people not to come to work everyday (road user charging, congestion and low emission zone charging). Season tickets are replaced by loyalty based carnet systems which further reinforce occasional commuting.
- We expect further increases in ‘co-working’ and ‘thermal hosting’, enabled by a series of policies including hubs, informal home office sharing clubs, changes in office building design and servicing to encourage higher densities and hot-desking (in particular sectors).
- In Shift demand scenario, we have assumed 25% work at home on some days by 2030 and 40% by 2050, leading to reduction of trips on average 30%. So, a further 10% of workforce reducing by at least 30% on average 3%; further 25% reducing by at least 30% = 7.5%.
- In the Transform demand scenario, we have assumed 40% work at home on some days by 2030 and 60% by 2050 (= further 25% of workforce reducing by at least 30% on average = 7.5%; further 45% reducing by at least 30% = 13.5%).
- Teleworking abstracts the longer commute trips and therefore has a disproportionately large impact on average trips lengths: Shift demand –10% (2030) and –15% (2050), Transform demand –15% (2030) and –25% (2050).
- The ‘proximity principle’ assumes that there is a movement towards living closer to work places (and services) – this is related to sustainable mobility and land use planning – and the 15-minute city. In the future large organisations such as NHS will instigate job swapping databases to enable people to work in closest locations. Previous reduction in distance per person due to ‘proximity principle’ has been around 7% since 2002. We assume modest changes in the future, but no highly Transform demand change: Shift demand –3% (2030) and –10% (2050), Transform demand –5% (2030) and –15% (2030). There is some counterbalance by increased trip lengths due to the growing gig economy; but the evidence is weak, so we assumed to keep this at +5% in both scenarios.
Travel for business
- We have seen a reduction of 19% in distance travelled per person for business since 2002 (from 702 to 510), which has been due to the 25% reduction in trips over the same period, not because average business trip length has changed – as it has stayed pretty static.
- So far, video and teleconferencing has not been reported to have led to a significant reduction in trips with the exception of some sectors. Telecoms and management consultancies are often quoted as being good examples of companies with a good strategy to promote telecommunications for business travel. PWC, for instance, claim that flights for internal meetings are down 88% – but less good news for meetings with clients (PWC UK, 2018).
- The changing structure of the job market (e.g. more gig economy) may mean more in-work trips, fuelled by an even greater move to a service economy than we have already had. However, it could be that new carbon reporting requirements (Scope 3 included) means that some of the suggestions of what could be achieved (e.g. tele/video conferencing could reduce business trips by 18% after 10 years, Smarter Choices study. Cairns et al 2008; Scottish Government 2013) may start to kick in. So, we assumed trip reductions for the Shift demand –10% (2030) and –20% (2050); Transform demand –15% and –30%. There will be a maximum reduction in trips as there are many ‘essential’ trips which cannot be avoided. Given the large proportion of in-work trips taken up by the NHS alone, e-healthcare could be a big factor here.
- Tele/video conferencing is likely to substitute for the longest business trip journeys; but some domestic air travel for business does switch to train and so we assumed that average trip lengths increase somewhat (5–8% by 2050).
Travel to school, place of education (also escort education)
- An older person makes very few work or education trips – just 24 trips per person per annum on average, less than 3% of their total annual trips (DfT 2018a). So, an ageing population is expected to lower trip rates somewhat (5% by 2050).
- Since 1995, average trip length by escort education has increased by 42%, implying there is scope to reduce this.
- We assume some ‘voluntary’ reductions in Shift demand (–10% by 2030 and –15% by 2050) but radical change in school selection policy (reversal of Education Act 1988) in Transform demand (–15% by 2030 and –25% by 2050). No other policy that could reduce number of school trips was assumed.
Travel for shopping and retail
- While per capita trip rates have fallen slightly since 2002 (from 230 trips to 189 trips since 1995/98 =18% in 20 years but only 1% in past five years), there has been a major uptick in short journeys for all purposes, particularly for shopping. An Ipsos MORI poll for the RAC Foundation undertaken in October and November 2016 found that a net 12% of respondents in urban areas (9% in rural areas) reported making fewer shopping trips in a vehicle than they did 12 months previously (RAC Foundation, 2017). Overall, distance travelled for shopping has decreased slightly, which can be directly associated with the trend to on-line and more multi-channel shopping; however, this is not the only explanation for the reduction in distance travelled and the 10% reduction in average trip length just in the past five years.
- We think this is due to some bigger/bulkier shopping switching to online and a reduction in out of town single shopping trips with more pass-by shopping blended into the commute for food shopping.
- While we expect increased parking charges in city centres and at out of town retail units, visits back to the local high street by sustainable modes will be encouraged through business rate changes and mixed use development (developing housing above shops). We have included these kind of trips in leisure and as part of pass by shopping (on the commute).
- We assume a further reduction in the near future as teleshopping continues to become normal for some goods with direct substitution (although there are limits). There is some growth in trips as some shopping are more akin to local leisure (e.g. coffee and browse), so we will see bespoke shopping trips decline (although recorded as local leisure, see below): Shift demand –10% (2030) and –15% (2050); Transform demand –15% (2030) and –20% (2050).
- More pass-by shopping on commute will reduce food shopping trips also (as these are recorded as commuting): Shift demand –10% (2030) and –15% (2050); Transform demand –15% (2030) and –20% (2050).
- We assume the reduction in average trip lengths for shopping will continue to 2030 as the retail sector reorganises to cope with online (and develops more retail ‘experience’ centres whereby shopping and leisure is blended (captured in an increase in local leisure, see below) and more of this is being done by public transport and active travel. However, the reduction in trip lengths halts after 2030 as the increased use of bigger agglomerations of shops for retail comparator experience has maximised.
- The introduction of parking charges in all public spaces and the restriction of cars in urban areas means that shorter, local journeys become more attractive. Also, the move towards use of walking and cycling which increases frequency but reduces average trip distance. Shift demand –10% (2030) and –10% (2050); Transform demand –15% (2030) and –15% (2050).
Travel for personal business (e.g. medical doctor, post office, hairdresser, dentist, hospital)
- On average those over 65 years of age make 33% more trips than the UK average person makes in a year for shopping and personal business purposes (e.g. almost twice the number of trips for medical purposes) (DfT, 2018a). We have assumed an increase in these kind of trips based on an ageing population – up to 10% by 2050 in the Transform demand scenario.
- It will increasingly be the norm to access many services such as banking and medical care on-line (accelerated by Covid-19). Some of the reduction due to ICT has already happened. Many of these journeys cannot be digitised i.e. majority of hospital, dentist, hairdressers. However, increased accessibility and usability of ICT will lead to some reduction: Shift demand –5% (2030) and –5% (2050); Transform demand –10% (2030 and –10% (2050).
- The gradual re-introduction of local clinics, post office and banking services in rural areas and restriction of cars in urban areas means that shorter, local journeys become more attractive. The proximity principle applies (see above): Shift demand –5% (2030) and –10% (2050); Transform demand –10% (2030) and –15% (2050).
Leisure travel – local (social entertainment, sports, visiting friends and family not at their home)
- Although the retired make more leisure trips as a proportion of their total trips, they make fewer in absolute terms than younger people (DfT, 2018a; Alsnih and Hensher, 2003). This is due to income and mobility factors and fewer trips for sport and visiting friends and family (Metz 2000). We assume that, on balance, there is a small increase due to the ageing population.
- We further assume a general shift in all age groups towards more local leisure trips at the expense of longer trips, so a small increase is assumed due to this effect. In the Transform demand case we assume even more local opportunities to stay local. Shift demand +10% (2030) and +10% (2050); Transform demand +10% (2030) and +15% (2050).
- A shift towards ‘slow modes’ (walking, cycling, e-biking, micro e-mobility for leisure) around the local area leads to a slight reduction in average trip lengths: Shift demand –5% (2030) and –10% (2050); Transform demand –10% (2030) and –15% (2050). E-bikes could have potential to increase distance travelled by bike and hence generous mode shift to bike for local leisure.
Leisure travel – distance (visiting friends and family at their home, day trips, holidays)
- Retired people – particularly above the age of 70 – tend to make more trips, but as they become older and disabilities intervene, trip making tails off (DfT, 2018a). In an ageing population one would expect it to fall on a per capita basis, which is supported by NTS data showing a remarkable and rapid decline in trip rates and distances by age (DfT, 2018a).
- Here we have assumed that a greater proportion of older people in the population means fewer commuting trips per cap, yet more shopping and long distance leisure trips. We also know that it is the over 65 who are flying the most and so we assume more of these transfer to domestic leisure. However, in the Transform demand case, we assume that the pressure to ‘stay local’ is very high and so being retired is not such an issue here. Shift demand +10% (2030) and +20% (2050); Transform demand +15% (2030) and +20% (2050).
- We assume fewer longer day trips because more people use sustainable transport options to destinations much closer to home instead of going out for the day further afield. But counterbalanced by some longer holiday trips to replace air travel abroad meaning that on balance, distances increase. There are limits, however, as the reduction in air travel is greater in Transform demand scenario and the pressure not to travel frequently for long distances (i.e. replacing the second holiday or weekends that used to be done by leisure) is high. So, no difference from Shift demand scenario overall. Shift demand and Transform demand +5% (2030) and +10% (2050).
2. Transport mode shift (SHIFT)
Table 2 shows the assumptions on mode shift for passenger transport by trip length and mode. The scale and pace of these shifts were informed by the socio-economic, structural and policy changes making up the LED storylines described earlier.
| Trip length | Mode shift | Shift | Transform | ||
|---|---|---|---|---|---|
| 2030 | 2050 | 2030 | 2050 | ||
| 0–1 miles (very short distance) | from car/van driver to walk | 20% | 25% | 25% | 30% |
| from car/van driver to conventional bicycle | 5% | 10% | 8% | 10% | |
| from car/van driver to car/van passenger | – | 5% | 5% | 10% | |
| from car/van driver to motorcycle/e-bike | 5% | 8% | 6% | 8% | |
| from car/van driver to local bus | 10% | 15% | 15% | 18% | |
| from car/van driver to Uber/taxi | 5% | 7% | 10% | 10% | |
| from car/van passenger to walk | 15% | 20% | 20% | 25% | |
| from car/van passenger to conventional bicycle | 5% | 5% | 8% | 10% | |
| from car/van passenger to motorcycle/e-bike | 3% | 5% | 5% | 8% | |
| from car/van passenger to local bus | 5% | 15% | 15% | 18% | |
| from car/van passenger to Uber/taxi | 3% | 10% | 10% | 10% | |
| from local bus to walk | 5% | 15% | 15% | 15% | |
| from local bus to bicycle | 3% | 10% | 8% | 8% | |
| from local bus to motorcycle/e-bikes | – | 5% | 5% | 5% | |
| 1–2 miles (short) | from car/van driver to walk | 10% | 20% | 15% | 20% |
| from car/van driver to conventional bicycle | 10% | 15% | 15% | 15% | |
| from car/van driver to car/van passenger | 5% | 10% | 10% | 15% | |
| from car/van driver to motorcycle/e-bike | 5% | 8% | 7% | 10% | |
| from car/van driver to local bus | 10% | 15% | 12% | 16% | |
| from car/van driver to car club | 2% | 5% | 5% | 5% | |
| from car/van driver to Uber/taxi | 3% | 5% | 10% | 10% | |
| from car/van passenger to walk | 15% | 15% | 20% | 20% | |
| from car/van passenger to conventional bicycle | 6% | 10% | 8% | 10% | |
| from car/van passenger to motorcycle/e-bike | 5% | 8% | 7% | 10% | |
| from car/van passenger to local bus | 5% | 15% | 12% | 16% | |
| from car/van passenger to car club | 2% | 4% | 2% | 5% | |
| from car/van passenger to Uber/taxi | 3% | 10% | 10% | 10% | |
| from local bus to walk | 10% | 12% | 15% | 15% | |
| from local bus to bicycle | 5% | 10% | 8% | 12% | |
| from local bus to motorcycle/e-bike | 5% | 8% | 7% | 12% | |
| from Uber/taxi to walk | 5% | 10% | 20% | 25% | |
| from Uber/taxi to conventional bicycle | 10% | 10% | 20% | 10% | |
| from Uber/taxi to motorcycle/e-bike | 3% | 8% | 10% | 12% | |
| from Uber/taxi to local bus | 5% | 10% | 10% | 12% | |
| from Uber/taxi to car club | 5% | 10% | 10% | 15% | |
| 2–5 miles (lower medium) | from walk to motorcycle/e-bike | 5% | 10% | 10% | 10% |
| from conventional bicycle to motorcycle/e-bike | 5% | 10% | 10% | 10% | |
| from car/van driver to walk | 5% | 7% | 8% | 10% | |
| from car/van driver to conventional bicycle | 5% | 8% | 8% | 8% | |
| from car/van driver to car/van passenger | 5% | 15% | 10% | 15% | |
| from car/van driver to motorcycle/e-bike | 5% | 10% | 8% | 8% | |
| from car/van driver to local bus | 5% | 10% | 10% | 10% | |
| from car/van driver to car club | 7% | 10% | 8% | 9% | |
| from car/van driver to Uber/taxi | 10% | 5% | 12% | 12% | |
| from car/van driver to light rail/tube | 2% | 5% | 5% | 5% | |
| from car/van passenger to walk | 5% | 7% | 8% | 10% | |
| from car/van passenger to bicycle | 5% | 6% | 8% | 8% | |
| from car/van passenger to motorcycle/e-bikes | 5% | 10% | 8% | 8% | |
| from car/van passenger to local bus | 3% | 10% | 10% | 10% | |
| from car/van passenger to car club | 6% | 8% | 7% | 9% | |
| from car/van passenger to Uber/taxi | 10% | 10% | 12% | 12% | |
| from car/van passenger to light rail/tube | 2% | 5% | 5% | 5% | |
| from local bus to walk | 5% | 8% | 8% | 10% | |
| from local bus to motorcycle/e-bike | 5% | 10% | 20% | 20% | |
| from Uber/taxi to walk | 5% | 12% | 10% | 13% | |
| from Uber/taxi to conventional bicycle | 5% | 7% | 7% | 8% | |
| from Uber/taxi to car/van passenger | – | – | 3% | 5% | |
| from Uber/taxi to motorcycle/e-bike | 5% | 15% | 10% | 15% | |
| from Uber/taxi to local bus | 5% | 15% | 20% | 25% | |
| from Uber/taxi to car club | 5% | 10% | 8% | 12% | |
| from Uber/taxi to light rail/tube | 5% | 8% | 10% | 12% | |
| 5–10 miles (medium) | from conventional bicycle to motorcycle/e-bike | 5% | 10% | 15% | 20% |
| from car/van driver to conventional bicycle | 2% | 5% | 4% | 6% | |
| from car/van driver to car/van passenger | 10% | 15% | 16% | 20% | |
| from car/van driver to motorcycle/e-bike | 5% | 10% | 10% | 15% | |
| from car/van driver to local bus | 5% | 8% | 8% | 10% | |
| from car/van driver to car club | 10% | 15% | 10% | 12% | |
| from car/van driver to Uber/taxi | 10% | 5% | 10% | 10% | |
| from car/van driver to light rail/tube | 3% | 6% | 8% | 10% | |
| from car/van passenger to bicycle | 2% | 5% | 4% | 6% | |
| from car/van passenger to motorcycle/e-bikes | 4% | 7% | 9% | 15% | |
| from car/van passenger to local bus | 5% | 8% | 8% | 10% | |
| from car/van passenger to car club | 5% | 10% | 10% | 12% | |
| from car/van passenger to Uber/taxi | 10% | 10% | 10% | 10% | |
| from car/van passenger to light rail/tube | 3% | 6% | 8% | 10% | |
| from local bus to motorcycle/e-bike | 3% | 10% | 5% | 10% | |
| from local bus to car club | 8% | 10% | 10% | 16% | |
| from local bus to light rail/tube | – | 5% | 5% | 7% | |
| from car club to motorcycle/e-bike | 3% | 8% | 5% | 10% | |
| from Uber/taxi to car/van passenger | – | – | 5% | 10% | |
| from Uber/taxi to motorcycle/e-bike | 5% | 15% | 15% | 20% | |
| from Uber/taxi to local bus | 5% | 10% | 13% | 15% | |
| from Uber/taxi to car club | 5% | 10% | 10% | 10% | |
| from Uber/taxi to light rail/tube | 2% | 5% | 10% | 15% | |
| 10–25 miles (upper medium) | from car/van driver to car/van passenger | 10% | 15% | 15% | 20% |
| from car/van driver to motorcycle/e-bike | 1% | 4% | 5% | 7% | |
| from car/van driver to local bus | 5% | 8% | 5% | 8% | |
| from car/van driver to national rail | 3% | 5% | 6% | 8% | |
| from car/van driver to car club | 8% | 10% | 10% | 15% | |
| from car/van driver to Uber/taxi | 5% | 4% | 5% | 3% | |
| from car/van driver to light rail/tube | 3% | 6% | 6% | 8% | |
| from car/van passenger to motorcycle/e-bikes | 1% | 4% | 5% | 7% | |
| from car/van passenger to local bus | 5% | 8% | 5% | 8% | |
| from car/van passenger to national rail | 3% | 5% | 6% | 8% | |
| from car/van passenger to car club | 5% | 8% | 8% | 15% | |
| from car/van passenger to Uber/taxi | 5% | 6% | 5% | 3% | |
| from car/van passenger to light rail/tube | 3% | 5% | 5% | 8% | |
| from local bus to motorcycle/e-bike | 3% | 10% | 5% | 7% | |
| from local bus to car club | 5% | 10% | 10% | 15% | |
| from local bus to light rail/tube | 2% | 4% | 7% | 10% | |
| from Uber/taxi to motorcycle/e-bike | 3% | 10% | 5% | 15% | |
| from Uber/taxi to local bus | 5% | 10% | 10% | 15% | |
| from Uber/taxi to national rail | 5% | 10% | 15% | 20% | |
| from Uber/taxi to light rail/tube | 5% | 10% | 10% | 20% | |
| from light rail/tube to motorcycle/e-bike | 3% | 10% | 5% | 7% | |
| 25–50 miles (lower long) | from car/van driver to car/van passenger | 10% | 20% | 15% | 20% |
| from car/van driver to express coach | 1% | 2% | – | – | |
| from car/van driver to national rail | 5% | 10% | 8% | 10% | |
| from car/van driver to car club | 10% | 15% | 15% | 20% | |
| from car/van driver to light rail/tube | 4% | 5% | 8% | 10% | |
| from car/van passenger to express coach | 1% | 2% | – | – | |
| from car/van passenger to rail/underground | 5% | 10% | 8% | 10% | |
| from car/van passenger to car club | 10% | 10% | 15% | 20% | |
| from car/van passenger to light rail/tube | 4% | 5% | 8% | 10% | |
| 50–100 miles (long) | from car/van driver to car/van passenger | 12% | 15% | 13% | 20% |
| from car/van driver to express coach | 5% | 8% | 6% | 10% | |
| from car/van driver to national rail | 8% | 10% | 10% | 15% | |
| from car/van driver to car club | 3% | 8% | 7% | 10% | |
| from car/van passenger to express coach | 5% | 8% | 6% | 10% | |
| from car/van passenger to national rail | 8% | 10% | 10% | 15% | |
| from car/van passenger to car club | 3% | 8% | 7% | 10% | |
| >100 miles (very long) | from car/van driver to car/van passenger | 8% | 15% | 15% | 15% |
| from car/van driver to express coach | 8% | 8% | 10% | 12% | |
| from car/van driver to national rail | 10% | 10% | 12% | 15% | |
| from car/van driver to car club | 3% | 8% | 10% | 15% | |
| from car/van passenger to express coach | 8% | 8% | 10% | 12% | |
| from car/van passenger to national rail | 10% | 10% | 12% | 15% | |
| from car/van passenger to car club | 3% | 8% | 10% | 15% | |
| from domestic air to express coach | 5% | 5% | 5% | 10% | |
| from domestic air to national rail | 15% | 15% | 15% | 30% | |
| Note: ‘car club’ includes national and local car clubs and other forms of car based mobility as a service. | |||||
Passenger transport (including domestic aviation)
Travel to work, school or place of education
- The Shift demand scenario sees an increase in flexible season tickets to encourage less than 5-day working weeks, as well as re-regulated public transport and expansion of services to result in sizeable mode shift away from private motorised transport. A ‘collectivise’ strategy features ramping up of tried and tested policies to encourage employer responsibility for travel to-work, which manifests itself as a package of workplace parking levies and green travel plans. Car-sharing, Demand Responsive Transport, and ‘works transport’ (i.e. employer contracted (mini)buses) are promoted and introduced in key employment areas. A ‘Go Dutch’ active travel strategy will get the UK towards Dutch levels of cycling and e-biking, via high quality infrastructure, slow mode prioritisation and culture change in many urban areas.
- The Transform demand scenario involves a renewed push for integrated regional transport and ticketing, which means extensive improvement in services across the commute. As with Shift demand, we see a sharp increase in flexible, affordable carnet style tickets to encourage less than 5-day working weeks. There will be an eco-levy on transport pricing that internalises external costs of congestion, air pollution and climate change. Free/re-regulated public and demand responsive transport will be extended in urban and rural areas. The above A ‘collectivise’ strategy will be scaled up and mandated for all medium and large enterprises. A new ‘low carbon-late’ employment policy includes travel time in work hours, incentivising slow travel. A ‘Go Double Dutch’ active travel strategy will get the UK beyond Dutch levels of cycling, via high quality infrastructure, slow mode prioritisation and culture change across the UK nations.
- It becomes socially unacceptable to drive the car alone to work. This cultural shift will be strengthened by ‘soft’ policies such as ‘infrastructures’ for hitch-hiking, ‘Realtime Ridesharing’, and preference for socially necessary employees akin to red plates.
- Many of these policy measures also have a positive effect on shifting school travel to more sustainable modes. Transform demand means more of the same of Shift demand.
- It becomes socially unacceptable to drive kids to school. Access to schools is made much safer, and access by car is restricted and phased out in the long term unless zero emission or shared. More short journeys are switched to alternative modes including e-scooters.
Business travel
- Both scenarios see more use of e-bikes, public transport and car sharing for short distance business trips, particularly in urban areas and employment clusters.
- Longer journeys are not easy to change; however, we see more use of rail and a shift away from single-occupancy car travel (ICT-enabled car sharing) and domestic flying.
- Beyond this, the Transform demand scenario sees even more use of national rail taking away from car and more use of pooled cars.
- Car occupancy rates creep up only very slowly, as the shortest business trips are transferred to other modes.
Travel for shopping and personal business.
- Online and multi-channel shopping for groceries and heavy and bulky items is gradually made easier and cheaper and (even) more convenient than it is in 2020. Recent empirical evidence on online grocery shopping in the UK supports a consumer segmentation approach to maximising its potential (Brand et al, 2020) and increasing many shoppers’ ability to conduct shopping without physically picking up any substantial items. As a result more and more shopping can easily be done without a car. Generational differences are marked with fewer younger travellers making physical shopping trips (Note the increase in delivery van and e-cargo bike travel has been taken into account here).
- Car sharing/clubs are used more for going shopping to out of town centres and some bulky retailers e.g. Ikea (other furniture brands are available), removing some trips by private car. Home delivery is normal, removing the ‘need for boot capacity’ as a reason for driving
- As explained above more car trips will be part of leisure or part of a commute rather than being a specific shopping trip. Also, short shopping trips with only one person in the car are reduced by restricting access and ‘high occupancy parking areas’, thus increasing the average occupancy.
- More local shopping (localism) means more walking, conventional cycling, e-biking (as in NL), and Demand Responsive Transport (esp. in rural areas). Local access restriction for single-occupancy car travel means local bus services receive a significant boost, resulting in bus mode share figures that are actually not much higher than they were in 2012.
- Private, non-EV car parking is going to be very restricted in town centres.
- We have assumed some cargo bike in the e-bike/scooter section based on data from leading cycle nations (Arvidsson and Pazirandeh 2017; Cairns et al 2017).
- We assume that an increasing share of the 45% of car driver/passenger trips that are related to longer distance non-emergency hospital travel are gradually switched to Demand Responsive Travel (organised centrally via a central booking system, as in Finland) (Davison et al, 2014; Ryley et al, 2014; Brand and Preston, 2003; Brand et al, 2004). This may also include a limited fleet of autonomous vehicles by 2050. The key incentives include increasingly punitive parking measures.
Social and leisure travel
- We see a major push to improve cycling, e-biking and e-scootering to access local leisure facilities and recreational areas over the next decade.
- Further away the use of car club cars and on-demand services for leisure are heavily promoted and priced cheaper than private car travel. National parks and other recreational hotspots are expanded and promoted. Access by private car will be restricted to those who cannot travel otherwise.
- The Transform demand scenario assumes more trip and vehicle sharing to local leisure sites.
- Long distance travel by air is priced out (APD, frequent flier levy) making travel by car club car, electric express coach and electric rail the natural choice to access holiday and leisure destinations. In the Transform demand case, additional revenue from a national road pricing scheme supports DRT, urban light rail, bus and national rail services.
Car occupancy and shared mobility
- The shared mobility inquiry (Marsden et al 2019) found levels of car occupancy of 1.77 in Sweden today so it is plausible to assume that the UK could move from 1.57 much quicker and within the general parameters set within the LED scenarios. Early estimates by the DfT suggest that in a shared model, shared mobility innovations could reduce future traffic growth to just 5% by 2050. In a more individualised model the growth could be as much as 55% (Marsden et al, 2019).
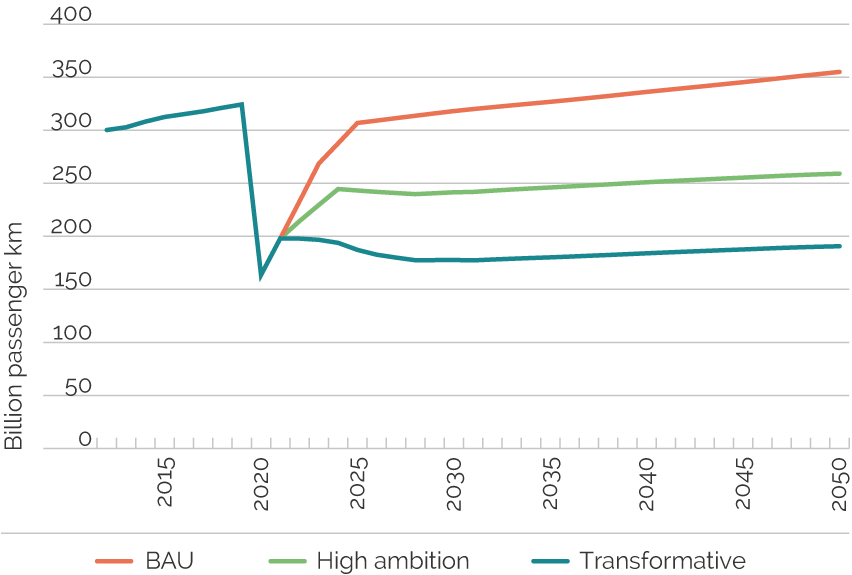
- Car occupancy rates were derived from projected car (as driver) and car (as passenger) data following mode shift calculations below. This was first done for each trip purpose and then aggregated to an all-purpose figure of between 1.9 (Shift demand) and 2.1 (Transform demand) by 2050 (see Results below).
Transport modes – assumptions and supporting evidence across the trip purposes:
- For bus and coach services, the government turns the current balance of capital expenditure and operational expenditure on its head from 2/3:1/3 to 1/3:2/3. That happens fairly quickly with a big injection for zero emission bus services in the 2020s. This affects trips in the 2 to 25 mile range (urban bus) and 25+ range for coaches.
- The evidence underlying our active travel assumptions is wide-ranging, if mostly from other countries and cities. For instance, Amsterdam achieved an increase in mode share for cycling from 21% to 33% over the period 1990–2013 and Copenhagen from 29% to 37% over the period from 1993–2013. So, half a percent per year in places which are good at doing this seems reasonable.
- In the Transform demand scenario we assumed that e-scooters and e-bikes are a game changer by becoming much more competitive with the car (and also public transport) for trips of 5 to 10 miles long.
Passenger transport – international aviation
- Prior to April 2020 the ICAO (International Civil Aviation Organization, a UN agency) expected emissions from international aviation to increase through to 2050 by a factor ranging from approximately two to four times the 2015 levels, depending on the type of emissions (CO2, NOx or PM) and the scenario used (ICAO, 2019). Even in the most optimistic, techno-centric case fossil fuel burn and CO2 would double between 2020 and 2050.
- Demand for international aviation saw a steady rise of about 5% since 2016 alone. This all changed in the spring of 2020, with flights being cancelled and aircraft grounded due to lockdown measures and international travel bans. Air passenger numbers were ~90% lower than ‘normal’ in the spring. Aircraft movements were ~65% lower during April–June. With restrictions being gradually lifted demand has picked up somewhat – but is still significantly lower than before.
- In the past (or at least the 2008/09 recession), aviation took longer than a lot of sectors to bounce back. Indeed, business air travel did not get back to pre-recession levels. There is reason to believe that this will happen again, particularly with even greater remote working and also, for leisure, the additional suppression of demand due to safety fears (as with 9/11, SARS). The current shrinkage of capacity by the airline industry is much greater than after these events, so it suggests the industry know they are in for a long recovery.
- For the BAU scenario in this study we have, therefore, assumed that the changes are not just temporary but represent a longer-term shift that sees demand staying 50% lower than expected until the end of 2021 then gradually recovering to 90% of 2019 levels over the following three years.
- The Shift demand scenario sees demand being suppressed by shifting social norms and ‘air user charging’. A new frequent flier levy and increased air passenger duty will reduce trip rates (people fly less but stay longer) thus reducing ‘hypermobility’ (Cohen and Gössling, 2015) and ‘binge flying’ (Cohen et al, 2011).
- In the Transform demand scenario, carbon tax/pricing is introduced during the 2020s to reflect external costs of flying (air pollution, climate change incl. contrails uplift, noise). This reduces demand somewhat (a few percent by 2030).
- Uptake of electric aircraft is limited to short haul routes and from the late 2020s onwards.
Road freight – vans / Light Commercial Vehicles (LCV)
- The number of light commercial vehicles (LCVs) has grown over the last two decades. There was a 48% increase in the number of LCVs licensed between 2000 and 2015, and a 47% increase in vehicle kilometres travelled by LCVs annually over this same period. LCV traffic growth has been more rapid than for any other vehicle type both nationally and in London. LCV use is for more than freight. They are used for everything from servicing (e.g. repair and maintenance of equipment), to carriage of equipment, providing transport, and goods delivery.
- Servicing activity will continue to make up a significant proportion of van activity, currently accounting for 58% of the total distance travelled by all LCVs – twice the total distance travelled by those used for the delivery/collection of goods (29%).
- Most of the thinking about consolidation comes from urban last mile logistics. We have assumed all miles on motorways and Trunk A roads are not ‘urban last mile’ and that 50% of principal A and minor roads mileage by LCVs is not ‘urban last mile’. That means 2/3 of mileage is not susceptible to urban last mile innovation. There is a strong case to suggest that improvements to last mile deliveries have fed back into lower costs and increased use of services – thereby limiting any absolute reductions which can be gained in this sector.
- Key van/LCV assumptions: Avoid: load factor improvement from 0.5 to 0.6. Shift: road to e-cargo bike 5% by 2030, 10% by 2050. Improve: electrify 30% of vans by 2030, and 100% by 2050. On-road fuel efficiency improvements (driving style, speed/acceleration limiters become mandatory), up to 6% real world improvements by 2030.
Road freight – trucks / Heavy Goods Vehicles (over 3.5 tonnes gross vehicle weight)
- Despite the rise of vans, HGV still dominate road freight in terms of tonnage, moving 88% of the overall amount of freight lifted by road, rail and water. Goods transport by road consumes around 50% of all diesel fuel and accounts for 80% of the global net increase in diesel use since 2000. Projections see road freight activity at least doubling by 2050, offsetting efficiency gains and increasing road freight CO2 emissions (ITF, 2018). Trucks are the fastest growing source of global oil demand, accounting for 40% of the oil demand growth by 2050 and 15% of the increase in global CO2 emissions, according to baseline projections by the ITF (ITF, 2018).
- Freight has proved difficult to decouple from economic activity, and modal shift away from road freight has been limited (McKinnon, 2007; McKinnon, 2018).
- There is uncertainty on what would be being moved by freight in the future – we assume any decreases in bulky materials is balanced by increases in moving food and retail goods from online services.
- Options to reduce energy demand include modal shift from road to rail (bulky, non-time critical freight), increasing loading of laden vehicles, improved routing efficiency (to reduce miles travelled per tonne moved), reduction in empty running (to increase load factors and therefore avoid unnecessary trips), improved vehicle efficiency, systemic improvements in logistics and increased uptake of alternative fuels (improve of carbon intensity of energy used) (ITF, 2018).
- The LED scenarios have assumed only modest improvements to vehicle efficiency as many efficiency gains have already been implemented in the industry over the past 30 years (e.g. an energy efficiency programme led by the Energy Saving Trust).
- Collaboration between logistics companies have the potential to generate significant cost savings and emissions reductions (ITF, 2018).The LED scenarios assume improved logistics and increased uptake of digital collaboration platforms, operated by neutral trusted third parties, that offer a promising pathway to overcome barriers to uptake in a commercially highly competitive industry.
- Key truck/HGV assumptions: Avoid: load factor improvement from 0.5 to 0.6. Shift: road to rail 5% by 2030, 10% by 2050. Improve: biofuels 20% by 2030, 50% by 2050; and H2 FCV 5% of HGV by 2030, and 20% by 2050. Improve: On-road fuel efficiency improvements (driving style, speed/acceleration limiters become mandatory, improved & mandatory aerodynamics, some platooning) sees 10% (Shift demand) and 15% (Transform demand) improvement per mile travelled.
Principles
Reductions in energy demand maintain or improve quality of life for a large majority of the population. See underlying storyline and modelling assumptions described above.
- Transition away from car based transport system means improved health, air quality, climate change mitigation, social exclusion, fuel poverty, less congestion (which in itself can have positive effects on the other outcomes), etc.
New technologies can have a positive effect on reducing energy demand by introducing new information to energy users and providing alternative business models and the promotion of novel energy services. See underlying storyline and modelling assumptions described above.
- First point: ICT, integrated ticketing, etc.
- Second point: shared mobility, etc.
They promote equality, avoiding increases or reducing distributional impacts. See underlying storyline and modelling assumptions described above.
- Public transport, active travel and shared mobility are more equitable than car-based transport system
- There may be some issues with increased costs for goods and some services? Unless paid for by national road user charging, for instance.
- Frequent flier levy is super equitable…
Rates of change are truly transformative but also have a basis in historical patterns of change while also not breaking physical laws. See underlying storyline and modelling assumptions described above.
- We generally believe the above changes are highly ambitious and transformative in the sense that they have not materialised anywhere as a complete, integrated package – all elements of the scenarios have happened successfully in some areas (e.g. active travel in NL; eco-driving programme in NL/Germany; high quality bus-based system in Curituba, Brazil; car ownership reductions in Freiburg, Germany, and so on)
Methods
Low Energy Demand within the transport-energy system was modelled using an established modelling tool suitable for policy analysis, the Transport Energy and Air pollution Model for the UK (TEAM-UK) (Brand et al, 2019). To date, the underlying transport-energy-environment system modelling framework has been applied in a number of prospective scenario (Brand et al, 2020a; Anable et al, 2012; Brand et al, 2017; Brand et al, 2019) and policy modelling studies. (Brand et al, 2013)
The transport demand model simulates passenger travel demand as a function of key travel indicators structured around data obtained from the UK National Travel Survey (DfT 2016), including the average number of trips and average distance travelled per person per year. These were further disaggregated by eight main trip purposes (commuting, business, long distance leisure, local leisure, school/education, shopping, personal business, other), eight trip lengths (Under 1 mile, 1–2 miles, 2–5 miles, 5–10 miles, 10–25 miles, 25–50 miles, 50–100 miles, and More than 100 miles) and twelve modes of passenger transport (walk, bicycle, car/van driver, car/van passenger, motorcycle, local bus, coach, rail and underground, other private, taxi, domestic air, other public). International air travel is modelled separately as a function of income (GDP/capita), population and supply and policy costs. Freight demand is simulated as a function economic activity (GDP/capita) and population, with reference demand elasticities taken from a RAND Europe study (Dunkerley et al, 2014).
The vehicle fleet turnover model provides projections of how vehicle technologies evolve over time for 1,246 vehicle technology categories, including 283 car and 566 van technologies (Vans = light commercial vehicles up to 3.5t gross vehicle weight, including panel & side vans, car derived vans, pickup & 4×4 vans, drop & tipper vans, box, Luton & insulated vans, and ‘other’ vans (campervans, etc.) such as increasingly efficient gasoline internal combustion vehicles (ICV), battery electric vehicles (BEV), plug-in hybrid electric vehicles (PHEV) and hydrogen (H2) fuel cell electric vehicles (FCEV). The car and van fleet models are the most detailed, including market (private vs. fleet/company, three car sizes/segments, six van types) and consumer segmentation (four private and two fleet/company segments for cars, two segments for vans). New vehicle choice is modelled using a hybrid discrete choice and consumer segmentation model, as described in Brand et al. (2019; Brand et al 2016). New car sales are a function of endogenously derived household car ownership and car scrappage, with the latter modelled as a function of average life expectancy via a S-shaped (modified Weibull) scrappage probability curve (Zachariadis, et al 2001). Based on existing age distributions, average car age was assumed to stay at 6.8 years, with 6.5 years for vans (The UK car fleet age profile implied a 50% scrappage probability applied for cars that were ~16 years old).
Total car ownership is modelled based on established methods (Whelan, 2007; DfT, 2013) taking into account household income, average vehicle costs, household location (urban, rural) and car ownership saturation rates for multiple car ownership. Total van ownership is based on extending historic trends based on expected economic growth – a reasonable assumption since road freight has proven rather difficult to decouple from economic growth.
To develop the LED scenarios we applied the socio-technical and policy factors mentioned earlier (see storylines) to each element of each journey purpose to calculate total changes in demand by each mode by 2030 and 2050. We also made a raft of additional assumptions and calculations about vehicle technology supply and regulatory constraints, and factors underlying the scale and speed of fleet evolution (scrappage probabilities, total household car ownership based on disposable income, public transport availability, driving license holding, etc.) – these have been detailed in the Evidence and Assumptions section above.
TEAM modelling outputs were aggregated and passed on to UKTM for the three scenarios, including:
- Energy service demands: passenger-km, tonne-km by mode and year
- Vehicle-km by mode and year (thus including occupancy rates and load factors)
- Mode specifics including modelled projections of shares of vehicle propulsion systems (primary fuel, engine/motor) for cars, buses, vans and trucks; efficiency improvements due to downsizing; changes to on-road fuel efficiency; vehicle lifetimes (based on age distributions); and car ownership rates (cars/1000 population).
- Demographic and socio-economic indicators the demand projections were based on.
Results
Energy use by mode and fuel
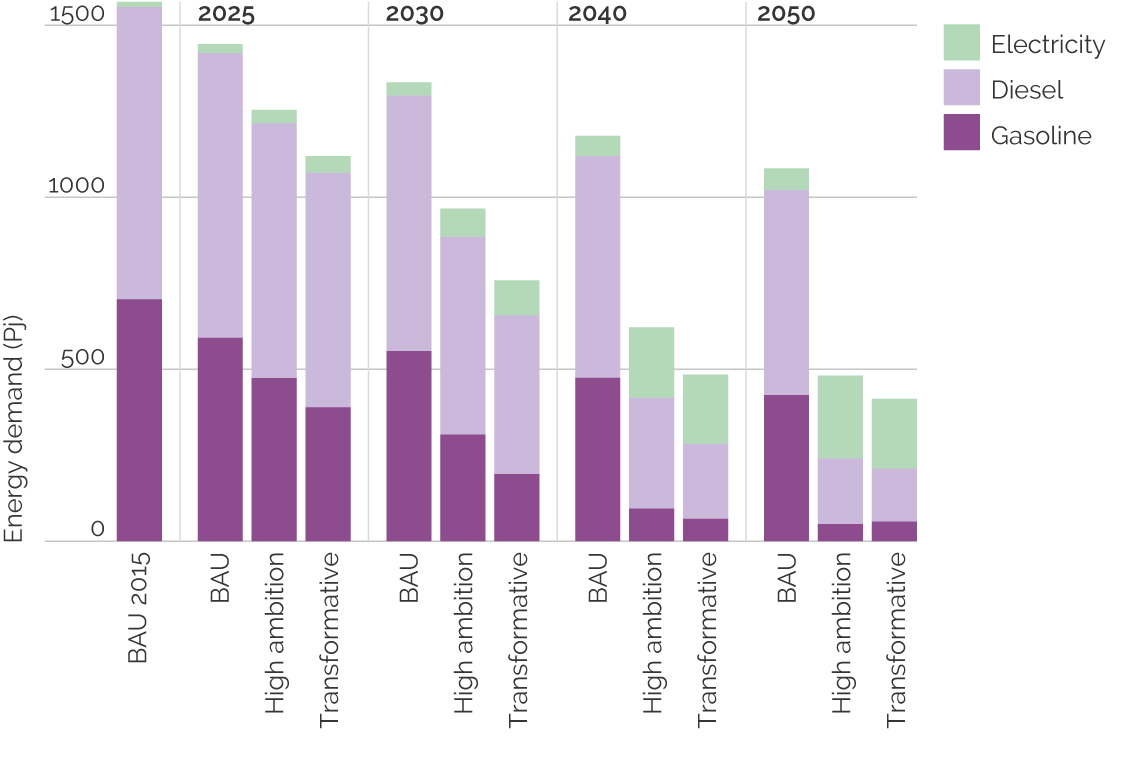
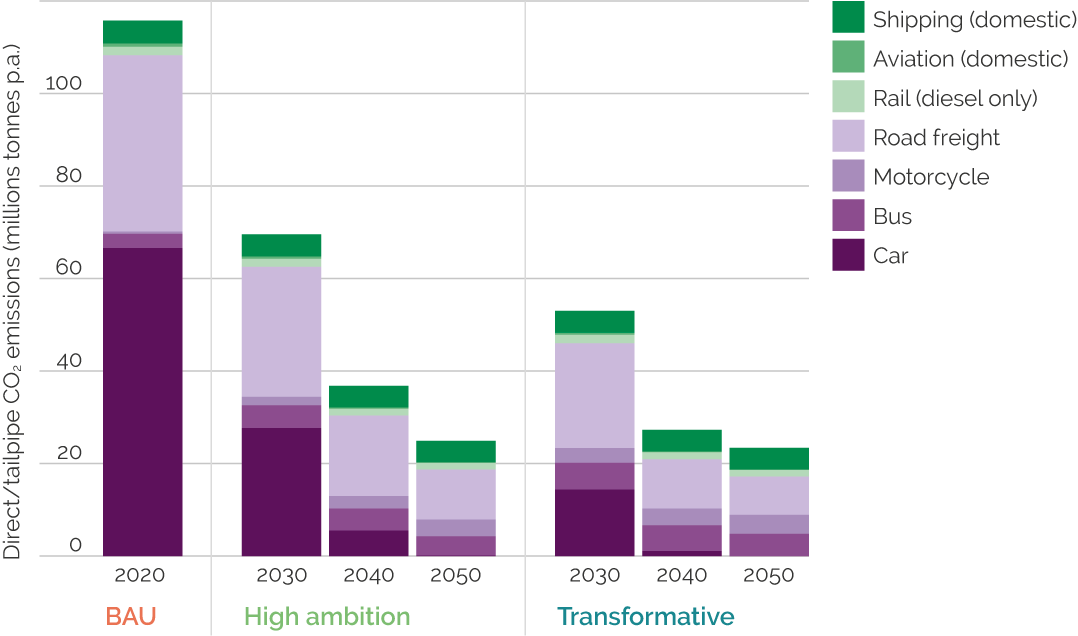
Energy service demands: passenger transport
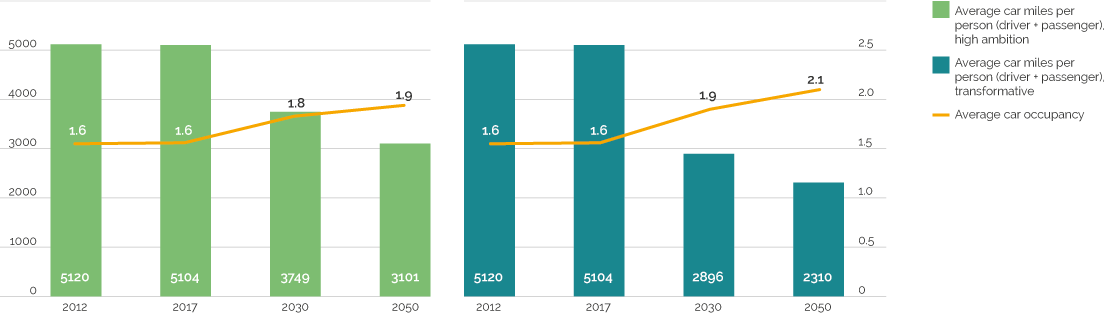
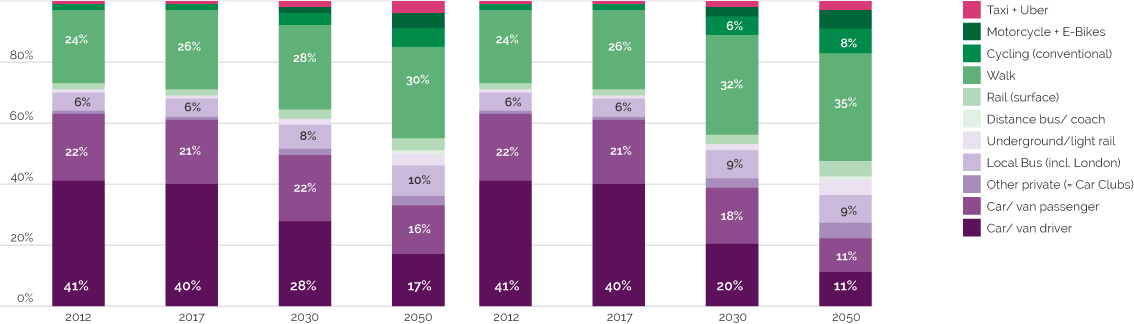
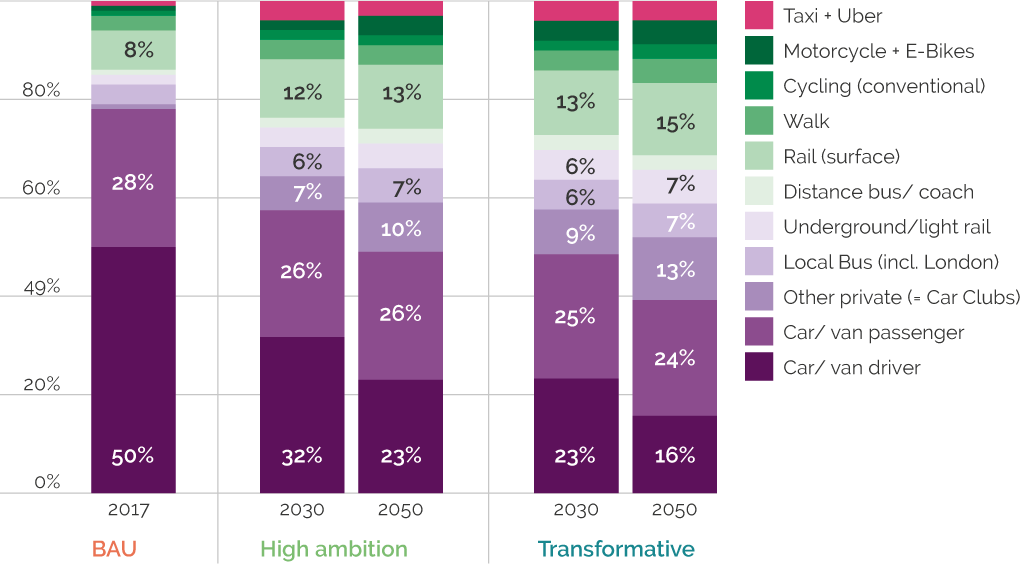
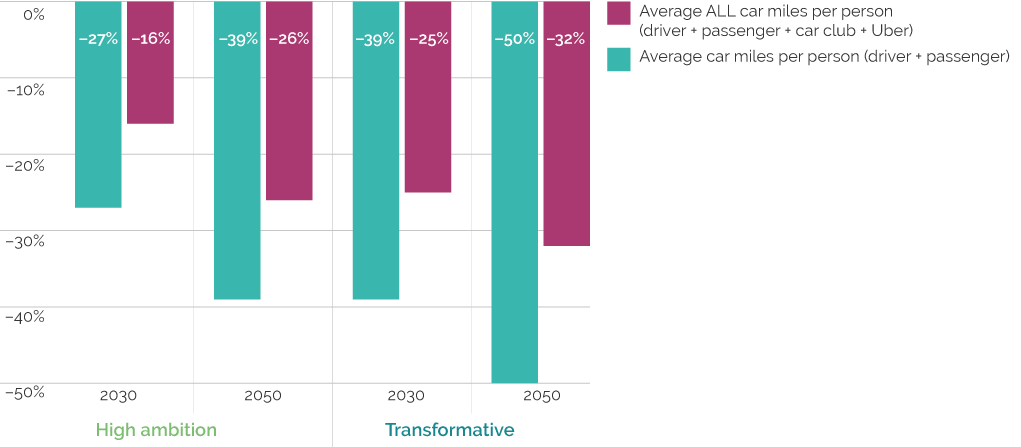
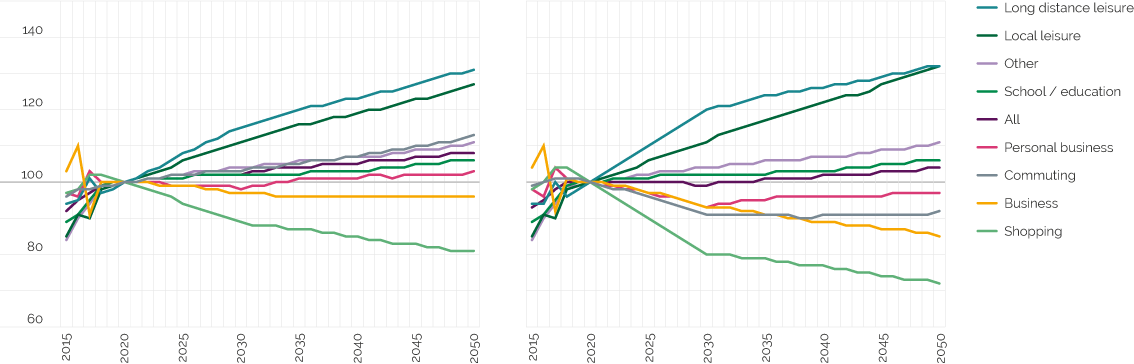
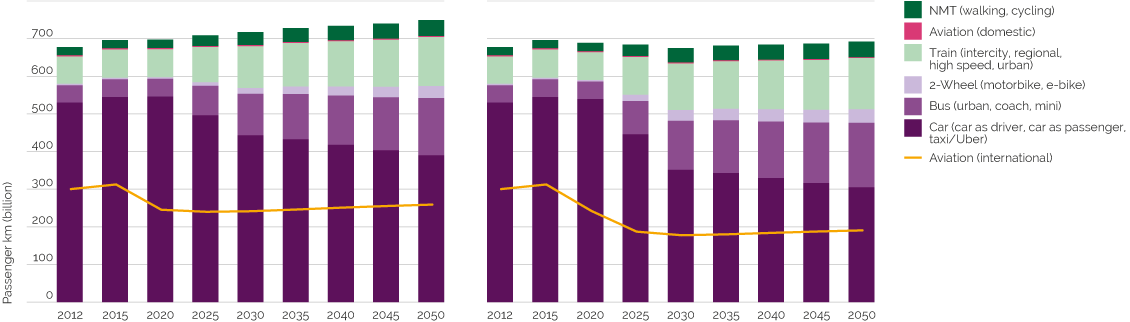
Energy service demands: international aviation
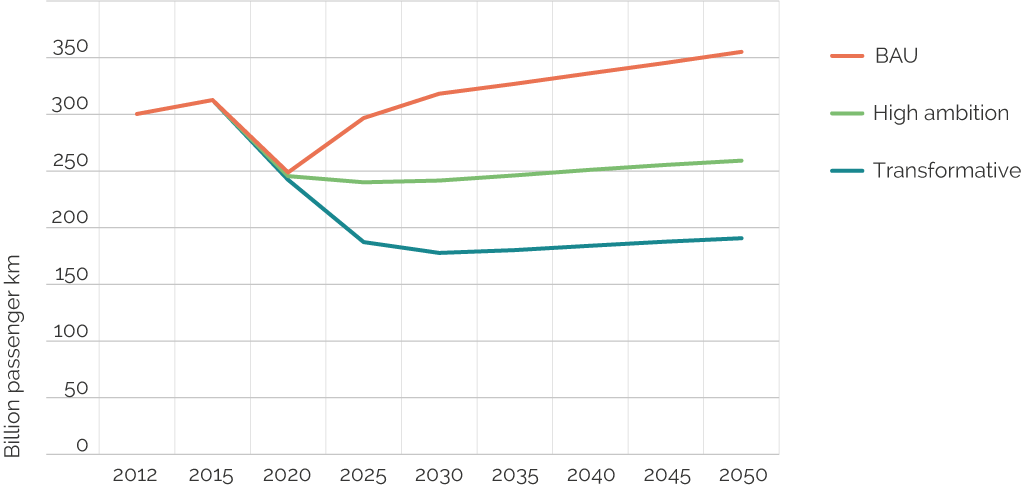
Energy service demands: freight transport
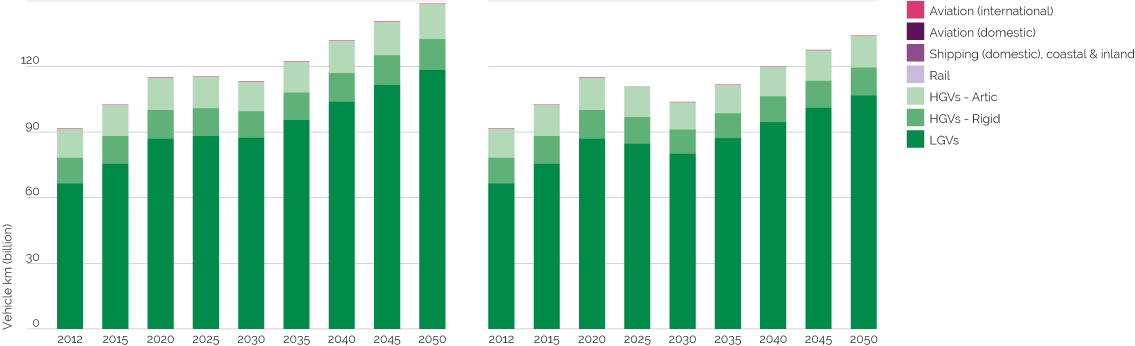
Vehicle fleet
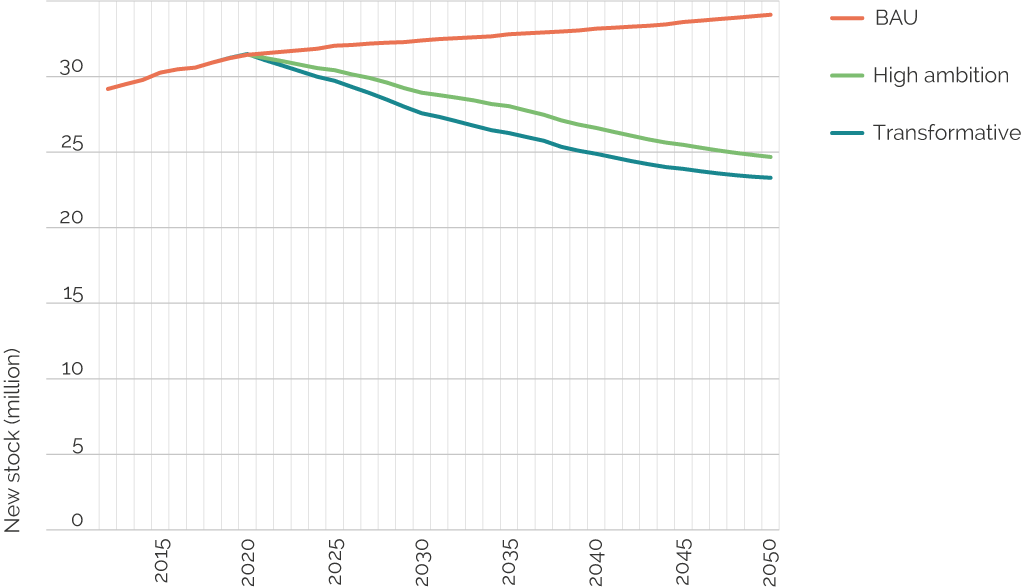
References
Alsnih, R. & Hensher, D.A. 2003. The mobility and accessibility expectations of seniors in an aging population. Transportation Research: Part A: Policy and Practice, 37: 903–916. doi: 10.1016/S0965-8564(03)00073-9
Anable, J., Brand, C., Tran, M. & Eyre, N. 2012. Modelling transport energy demand: A socio-technical approach. Energy Policy, 41: 125–138. doi: 10.1016/j.enpol.2010.08.020
Arvidsson, N. & Pazirandeh, A. 2017. An ex ante evaluation of mobile depots in cities: A sustainability perspective. International Journal of Sustainable Transportation, 11: 623–632. doi: 10.1080/15568318.2017.1294717
Banister, D., Newson, C. & Ledbury, M. 2007. The costs of transport on the environment – the role of teleworking in reducing carbon emissions, pdf. Working Paper No 1024. Oxford: Transport Studies Unit, University of Oxford.
BEIS (Department for Business, Energy, & Industrial Strategy), 2018. Digest of UK Energy Statistics (DUKES): energy. London: Crown Copyright.
BEIS, 2019. Energy consumption in the UK. London: Crown Copyright.
Brand, C. & Preston, J. 2003. Which technology for urban public transport? Proceedings of the Institution of Civil Engineers – Transport, 156 (4): 201–210. doi: 10.1680/tran.2003.156.4.201
Brand, C. 2016. Beyond ‘Dieselgate’: Implications of unaccounted and future air pollutant emissions and energy use for cars in the United Kingdom. Energy Policy, 97: 1–12. doi: 10.1016/j.enpol.2016.06.036
Brand, C., Anable, J. and Dixon, J. 2020(b). Response to DfT Consultation – ending the sale of new petrol, diesel and hybrid cars and vans. UK Energy Research Centre and Centre for Research into Energy Demand Solutions.
Brand, C., Anable, J. & Morton, C. 2019. Lifestyle, efficiency and limits: modelling transport energy and emissions using a socio-technical approach. Energy Efficiency, 1: 187–207. doi: 10.1007/s12053-018-9678-9
Brand, C., Anable, J. & Tran, M. 2013. Accelerating the transformation to a low carbon passenger transport system: The role of car purchase taxes, feebates, road taxes and scrappage incentives in the UK. Transportation Research: Part A: Policy and Practice,49: 132–148 doi: 10.1016/j.tra.2013.01.010
Brand, C., Anable, J., Ketsopoulou, I. & Watson, J. 2020(a). Road to zero or road to nowhere? Disrupting transport and energy in a zero carbon world. Energy Policy, 139: 111334. doi: 10.1016/j.enpol.2020.111334
Brand, C., Anable, J., Philips, I. & Morton, C. 2019. Transport Energy Air pollution Model (TEAM): Methodology Guide. Working Paper UKERC/DM/2019/WP/01. London: UK Energy Research Centre.
Brand, C., Cluzel, C. & Anable, J. 2017. Modeling the uptake of plug-in vehicles in a heterogeneous car market using a consumer segmentation approach. Transportation Research: Part A: Policy and Practice, 97: 121–136, doi: 10.1016/j.tra.2017.01.017
Brand, C., Raje, F., Preston, J. & Grieco, M. 2004. Transport and access to health care : the potential of new information technology. Final Report. Oxford: Transport Studies Unit, University of Oxford.
Brand, C., Schwanen, T. & Anable, J. 2020. ‘Online omnivores’ or ‘willing but struggling’? Identifying online grocery shopping behavior segments using attitude theory. Journal of Retailing and Consumer Services, 57. doi: 10.1016/j.jretconser.2020.102195
Cairns, S., Sloman, L, Newson, C., Anable, J., Kirkbride, A. and Goodwin, P. 2004. Smarter choices – changing the way we travel. Final report of the research project: The influence of soft factor interventions on travel demand. London: Crown Copyright.
Cairns, S., Sloman, L, Newson, C., Anable, J., Kirkbride, A. and Goodwin, P. 2008. Smarter choices: Assessing the potential to achieve traffic reduction using ‘soft measures’. Transport Reviews, 28 (5): 593–618. doi: 10.1080/01441640801892504
Cairns, S., Behrendt, F., Raffo, D., Beaumont, C. & Kiefer, C. 2017. Electrically-assisted bikes: Potential impacts on travel behaviour. Transportation Research: Part A: Policy and Practice, 103: 327–342, doi: 10.1016/j.tra.2017.03.007
CCC, 2018. Reducing UK emissions – 2018 Progress Report to Parliament. London: Climate Change Committee.
CCC, 2019. Net Zero – The UK’s contribution to stopping global warming. London: Climate Change Committee.
Cohen, S. A. & Gössling, S. 2015. A darker side of hypermobility. Environment and Planning A: Economy and Space, 47: 166–1679. doi: 10.1177/0308518X15597124
Cohen, S.A., Higham, J.E.S. & Cavaliere, C.T. 2011. Binge flying: Behavioural addiction and climate change. Annals of Tourism Research, 38: 1070-1089. doi: 10.1016/j.annals.2011.01.013
Davison, L., Enoch, M., Ryley, T., Quddus, M. & Wang, C. 2014. A survey of demand responsive transport in Great Britain. Transport Policy, 31: 47–54. doi: 10.1016/j.tranpol.2013.11.004
DfT (Department for Transport), 2013. Road Transport Forecasts 2013, Results from the Department for Transport’s National Transport Model. London: Crown Copyright.
DfT, 2016. National Travel Survey, 2002–2014: Special Licence Access. [data collection]. 4th Edition. SN: 7553, UK Data Service. London: Crown Copyright. doi: 10.5255/UKDA-SN-7553-4
DfT, 2018a. Analyses from the National Travel Survey, Statistical Release 18 January 2018, pdf. London: Crown Copyright.
DfT, 2018b. Road Traffic Forecasts 2018: Moving Britain ahead, pdf. London: Crown Copyright.
DfT, 2020. Road Investment Strategy 2 (RIS2): 2020 to 2025. London: Crown Copyright.
Dunkerley, F., Rohr, C. & Daly, A. 2014. Road traffic demand elasticities: A rapid evidence assessment. Cambridge: RAND Europe; Crown Copyright.
EEA, 2011. Laying the foundations for greener transport – TERM 2011: transport indicators tracking progress towards environmental targets in Europe. Copenhagen: European Environment Agency.
Faulconbridge, J., Jones, I., Marsden, G. & Anable, J. 2020. Work, ICT and travel in multinational corporations: the synthetic work mobility situation. New Technology, Work and Employment, 35: 195–214. doi: 10.1111/ntwe.12162
Fulton, L.M. 2018. Three revolutions in urban passenger travel. Joule, 2: 575–578. doi: 10.1016/j.joule.2018.03.005
Gota, S., Huizenga, C., Peet, K., Medimorec, N. & Bakker, S. 2019. Decarbonising transport to achieve Paris Agreement targets. Energy Efficiency, 12: 363–386. doi: 10.1007/s12053-018-9671-3
Hook, A., Court, V., Sovacool, B.K. & Sorrell, S. 2020. A systematic review of the energy and climate impacts of teleworking. Environmental Research Letters, 15: 093003. doi: 10.1088/1748-9326/ab8a84
hSo, 2020. London: hSo.
ICAO, 2019. Environmental Trends in Aviation to 2050, pdf. Canada: International Civil Aviation Organization.
IEA, 2018. CO2 emissions from fuel combustion. Overview, pdf. Paris: International Energy Agency.
ITF, 2018. Towards road freight decarbonisation trends measures and policies, pdf. ITF Policy Paper. Paris: OECD Publishing.
Marsden, G., Anable, J., Chatterton, T, Docherty, I, Faulconbridge, J, Murray, L. and Roby, H. 2016. Fleximobility: unlocking low carbon travel, pdf. Leeds: Institute for Transport Studies, University of Leeds.
Marsden, G., Anable, J., Bray, J., Seagriff, E. & Spurling, N. 2019. Shared mobility – where now, where next? Second report of the Commission on Travel Demand. Centre for Reseach into Energy Demand Solutions. Oxford. ISBN: 978-1-913299-01-9.
Marsden, G., Dales, J., Jones, P., Seagriff, E. & Spurling, N 2019. All Change? The future of travel demand and the implications for policy and planning, First Report of the Commission on Travel Demand, ISBN: 978-1-899650-83-5.
McKinnon, A.C. 2007. Decoupling of road freight transport and economic growth trends in the UK: An exploratory analysis. Transport Reviews, 27: 37–64: doi: 10.1080/01441640600825952
McKinnon, A. 2018. Decarbonizing logistics: Distributing goods in a low-carbon world. London: Kogan Page. EAN: 9780749483807
Melia, S., Chatterjee, K. & Stokes, G. Is the urbanisation of young adults reducing their driving? Transportation Research: Part A: Policy and Practice, 118: 444–456, doi: 10.1016/j.tra.2018.09.021
Metz, D.H. 2000. Mobility of older people and their quality of life. Transport Policy, 7: 149–152. doi: 10.1016/S0967-070X(00)00004-4
Mueller, N., Rojas-Rueda, D., Khreis, H., Cirach, M., Andrés, D., Ballester, J. et al. 2020. Changing the urban design of cities for health: The superblock model. Environment International, 134: 105132. doi: 10.1016/j.envint.2019.105132
OLEV (Office for Low Emission Vehicles), 2018. Low-emission vehicles eligible for a plug-in grant. London: Crown Copyright.
ONS, 2016. Home workers rates and levels: January to March 2015. London: Office for National Statistics.
ONS, 2002. Labour Market Trends, June 2002 and October 2002 editions. London: Office for National Statistics, London.
Paul, K. 2019. Microsoft Japan tested a four-day work week and productivity jumped by 40%. London: The Guardian.
Plötz, P., Funke, S.Á. & Jochem, P. 2018a. Empirical fuel consumption and CO2 emissions of plug‐in hybrid electric vehicles. Journal of Industrial Ecology, 22: 773–784. doi: 10.1111/jiec.12623
Plötz, P., Funke, S.Á. & Jochem, P. 2018b. The impact of daily and annual driving on fuel economy and CO2 emissions of plug-in hybrid electric vehicles. Transportation Research: Part A: Policy and Practice, 118: 331–340. doi: 10.1016/j.tra.2018.09.018
Plötz, P., Moll, C., Bieker, G., Mock, P. & Li, Y. 2020. Real-world usage of plug-in hybrid electric vehicles: Fuel consumption, electric driving, and CO2 emissions. Berlin: International Council on Clean Transportation.
PWC UK, 2019. Corporate sustainability: Lessons learned – acting on carbon: Our 10 year journey, pdf. London: PWC.
RAC Foundation, 2017. The implications of internet shopping growth on the van fleet and traffic activity, pdf. London: RAC Foundation.
Ryley, T.J., Stanley, A.P., Enoch, M., Zanni, A.M. & A. Quddus, M. 2014. Investigating the contribution of Demand Responsive Transport to a sustainable local public transport system. Research in Transportation Economics, 48: 364–372. doi: 10.1016/j.retrec.2014.09.064
Schipper, L. & Marie-Liliu, M. 1999. Flexing the link between transport greenhouse gas emissions: a path for the World Bank. Paris: International Energy Agency.
Scottish Government, 2013. Going smarter, Final Report – monitoring and evaluation of the Smarter Choices, Smarter Places Programme, pdf. Edinburgh: The Scottish Government.
SMMT, 2018. New car CO2 report 2018: The 17th report, pdf. London: The Society of Motor Manufacturers and Traders.
SMMT, 2020. SMMT new car registrations, September 2020 data. London: Society of Motor Manufacturers and Traders.
UKCES (UK Commission for Employment and Skills), 2014. The future of work: jobs and skills in 2030, pdf. London: Crown Copyright.
UTG, 2020. The Covid-19 funding gap: The case for continuing support for urban public transport, pdf. Ref: 23930401. Leeds: Urban Transport Group.
Vine, S.L., Polak, J. & Humphreys, A. 2017. Commuting trends in England 1988–2015, pdf. London: Department for Transport, Crown Copyright.
Whelan, G. 2007. Modelling car ownership in Great Britain. Transportation Research: Part A: Policy and Practice, 41 (3): 205–219. doi: 10.1016/j.tra.2006.09.013
Zachariadis, T., Ntziachristos, L. & Samaras, Z. 2001. The effect of age and technological change on motor vehicle emissions. Transportation Research Part D: Transport and Environment, 6: 221–227. doi: 10.1016/S1361-9209(00)00025-0
Citation
Brand, C., Anable, J. and Marsden, G. 2021. The role of energy demand reduction in achieving net-zero in the UK: Transport and mobility. Centre for Research into Energy Demand Solutions. Oxford, UK.