
Materials & products
Reading time: 23 minutes
Jonathan Norman, Kate Scott and Jannik Giesekam
Background
Resource efficiency and energy efficiency were both considered for reducing energy demand for the production of materials and products. Resource efficiency strategies reduce the required output of materials and products. Energy efficiency strategies reduce the energy demand to produce each unit of output. Additionally changes in construction demand are an important driver of material production and associated energy demand.
Energy efficiency options covered both the improvement and replacement of energy using processes within the UK industrial sector (and may also include fuel switching, which is encompassed in energy efficiency here and is not discussed separately). Resource efficiency strategies include measures within industrial production processes (for example improved product yields), and also measures that would supply the same consumer service, whilst reducing the requirement for materials and products (for example longer life clothing). These resource efficiency strategies are applied to a reference scenario of industrial production and final demand. The whole supply chain impacts of resource efficiency are determined using multi-regional input-output (MRIO) analysis. Due to the importance of the construction sector it was assessed in detail using a more detailed approach.
The construction sector is the largest user of materials in the UK and the largest producer of waste by tonnage (GCB, 2020). The sector is the principal consumer of a large proportion of industrial output, particularly of key materials, such as cement and steel.
There is potential to reduce demand for production of these materials (and the corresponding energy demand) by changing national demand for new buildings and infrastructure; and how these assets are designed and delivered.
The demand for new domestic and non-domestic buildings is determined by numerous socio-economic factors; and also by approaches to refurbishment and adaptive re-use of the existing building stock. Demand for new infrastructure assets is similarly shaped by grand societal choices, e.g. acceptable modes of transportation; preferred power sources etc. Differing choices, e.g. rail versus road, will yield substantially different requirements for infrastructure and corresponding industrial material manufacture. The material and energy intensity of an asset can be reduced through various changes in processes, materials, and construction techniques (see (Giesekam et al., 2014) for an overview). Demand for new material manufacture can also be reduced through the increased re-use of existing materials, components and structures.
Recognising the significance of this sector, and the substantive opportunities for mitigation by middle actors, in this analysis we attempt to derive future estimates of demand for key construction materials based upon scenarios of future demand for buildings and infrastructure and uptake of a range of mitigation measures that may reduce the quantity of new materials required to service this demand.
Evidence and assumptions
Energy efficiency scenarios are based on the existing technology options within the UK TM model, which themselves are based on a review of technological options at the level of industrial subsectors in the UK Energy Research Centre Usable Energy Database (Griffin el al. 2013). This database represents the most complete, transparent and accessible resource available for assessing energy improvement opportunities within UK industry and was developed to improve the representation of the industrial sector within UK TM.
Resource efficiency options were based on an existing review of opportunities for the UK (Scott el al. 2019). This is the widest extant assessment of such options for the UK and has been used extensively by (amongst others) the Committee on Climate Change in informing the potential for resource efficiency within their carbon budget analysis (CCC 2020). The resource efficiency opportunities related to construction and nutrition from the previous analysis of Scott et al. (2019) were not included in the current assessment as each is analysed independently here.
Although a wide range of studies explore mitigation options within construction, the evidence base for this sector is still less well developed than for many others, with few meta-studies and established models, and no standardised means of classification. Therefore a dedicated model was created for this analysis, based upon best available data.
An extensive list of mitigation options to reduce material demand from construction was assembled through a literature review of academic publications and industrial case studies. This incorporated >60 publications, some of which detailed multiple mitigation measures. Information on the individual mitigation measures and their corresponding source is available on request. The methods section below explains how these were incorporated into the analysis.
Principles
Energy efficiency opportunities within industry offer demand reduction opportunities without impacting the product or service delivered to the final user, they offer lower operating costs to businesses (although may require capital investment). Technologies were selected that offered the most significant energy reductions, and are currently, or close to, commercialisation. Industry has a history or gradual improvements of energy efficiency as they seek lower costs.
Resource efficiency opportunities may be invisible to the final consumer (e.g. higher yield production processes) or require some element of behaviour change (e.g. longer lasting clothing), however they are chosen so that the service delivered to the final consumer (if not the exact product) is retained. Adopting these strategies will encourage alternative business models that provide a high quality service rather than a disposable product. Environmental benefits beyond energy (and emissions) savings are significant with a reduced requirement for raw materials associated with these strategies. The large-scale adoption of such strategies would be transformative, but the evidence for the strategies is based on case studies, albeit at a smaller scale.
In construction the majority of the mitigation measures implemented do not result in substantive changes to the service experience of the end user. For instance, if a lower impact form of insulation is used that provides the same thermal performance, this is unlikely to have any impact upon equity or quality of life. The uptake of some alternative materials may require changes in consumer preferences (e.g. in aesthetics), but research on public perceptions of such materials suggests that this is unlikely to be the principle barrier to greater uptake, with changes in industry preferences, business models and supply chains constituting more substantive barriers (see e.g. (Giesekam, Barrett and Taylor, 2016)). Throughout, the scenario endeavours to include substantive changes in practices but subject to practical limitations. For instance, for some mitigation measures, uptake rates have been restricted based upon the anticipated challenges in development of associated supply chains and recruiting sufficiently skilled labour.
Methods
Energy efficiency
Energy efficiency options were based on UK TM making technology selections for each sector in a cost optimal manner, to reach the emissions targets of each scenario. A common limitation with analyses of the industrial sector is the high variability of energy using processes throughout the sector, with restrictions on data availability for both current energy use and improvement opportunities limiting the level of disaggregation that can be achieved in practice (Griffin et al. 2016). The sectors represented in UK TM, covered by this analysis are: Iron and steel, non-ferrous metals, cement, non-metallic minerals, chemicals (ammonia), chemicals (high value chemicals), chemicals (other), paper and others. Food and drink manufacturing is also a subsector of industry in UK TM and energy efficiency opportunities are assessed in the same manner as the rest of industry. However the output requirements are determined by the nutrition sector analysis.
Resource efficiency
The impact of resource efficiency scenarios was estimated using a multi-regional input-output (MRIO) model (Owen et al. 2017) to determine the supply chain impacts of resource efficiency measures and ultimately the effect on production requirements from UK industry. Resource efficiency changes were represented by changing industry-to-industry and industry-to-final consumer economic transactions, representing flows of materials and products through the economy. For example, a yield improvement in manufacturing a product would be represented as a reduction in the flow from the material supply industry (e.g. steel) to the product manufacturing industry (e.g. vehicles).
A longer life product would result in reducing the flow of this product (e.g. wearing apparel) to final consumers (e.g. households). Following such changes in flows to represent the resource efficiency strategies, the MRIO model allows the full supply chain impacts of the strategies to be determined. The baseline production system, for 2013, including the current balance of trade, is retained in future years, with resource efficiency strategies applied onto this baseline. For the current work the impact of the strategies on the change in total output of UK industries is of principal interest. A more detailed description of the methodology and details of the included strategies can be seen in the related publication (Scott et al. 2019). Forty-four strategies were included in the current assessment.
Strategies related to construction and nutrition (food and drink) were removed as they were assessed independently. Additionally strategies that impact the number of vehicles produced (e.g. longer life passenger cars) were not included as the transport sector scenario was used to inform this area, as discussed below.
The resource efficiency strategies included represent what could be achieved by UK actions. A UK actor may be the supplier and/ or consumer for each of the strategies. Due to international trade the impacts of the strategies can be seen in overseas regions, as well as in the UK. Such impacts are not captured here as the analysis focuses on UK impacts. Additionally, UK production supplies not only the UK, but also industries and final consumers overseas. Therefore, to impact the entirety of UK production resource efficiency strategies would also need to be pursued by these overseas actors. These opportunities are not included in the current analysis, which focuses on UK action. There is therefore potential for the output of materials and products from UK industries to further reduce if resource efficiency is pursued in overseas markets.
The previous assessment drawn on in this study (Scott et al. 2019) estimated the effect of strategies for 106 sectors in the UK economy in 2032 (to align with the CCC’s fifth carbon budget). Here the medium and high scenarios from the previous work were adopted as the Shift demand and Transform demand scenarios represented in the current work. The results of the 106 sectors of the MRIO model were aggregated to align with the eight subsectors in the industrial sector of UK TM (see Table 3 in the appendix for details of the aggregation between the MRIO and UK TM sectors).
Where a number of sectors were aggregated within a UK TM sector the output changes of each sector was weighted by the baseline emissions intensity of production, so that sectors with a higher emissions intensity had a greater impact on the aggregated sector than a sector with a lower emissions intensity of production. The change in output implied by the strategies was then backcast and forecast from 2032, at the level of UK TM sector, to cover the period of the current study (2020-2050). A logistic model was used in the forecasting and backcasting, being often adopted for the uptake of new technologies and strategies (Meyer 1994). The parameters of the logistic model were determined by fitting to the 2032 value and expert judgement, this considered how well the resource efficiency strategies included covered activities within the UK TM sector, and the broad prospects for the use of these strategies beyond those that were explicitly modelled in 2032.
The transport scenario of the wider analysis has implications for vehicle demand in the UK. The transport scenario can be used to define sales of aeroplanes, buses, cars, motorcycles, ships, trains and trucks. These vehicle sales were transformed into inputs to the resource efficiency model, and ultimately into the impact on UK TM sectors as above. It was found the impact on UK TM sectors was minimal (less than 1% reduction in output for the “Other” sector: being the UK TM sector most effected). This minimal impact is due to a combination of: vehicle production sectors being aggregated with a number of other sectors within UKTM; decreases in production of cars and aeroplanes being offset by increases in buses, motorcycles and trains; and much of the impact of a change in UK demand for vehicles is felt by overseas production. Given the minimal effect the impact of these change in vehicles sales was therefore not included in the final results.
Results are presented as relative changes in output for each of the UK TM sectors. These relative changes are combined with the reference case of output from UK TM (which is aligned with the BEIS Industrial Pathways Model, 2017) to form the absolute output from each sector for the two scenarios. Where a sector is also impacted by the construction analysis the method for combining the two analyses is given below.
Construction
A dedicated model was developed to estimate future demand for key materials under each scenario. Full documentation is available on request. The following paragraphs provide a high level overview of the model.
The model considers demand for new construction of various asset categories (and sub-categories) of ‘Domestic buildings’ (Houses and Flats); ‘Non-domestic buildings’ (Commercial Offices, Education, Government, Health, Retail, Sport and Leisure, Warehouses, Other) and ‘Infrastructure’ (Water, Sewerage, Electricity, Roads, Railways, Harbours, Other (including Air, Gas & Communications)). The use of iron and steel, cement and other non-metallic minerals (to align with the UKTM sectors) across a range of applications within each of these categories was apportioned based upon a set of material flow analyses (MFA). These analyses detailed five high-level applications of iron and steel (e.g. rebar); 24 applications of cement (e.g. lightweight blocks); and seven applications of other non-metallic minerals (e.g. concrete aggregate) by asset category and sub-category (e.g. Non-domestic buildings > Retail). By this means the model baseline sets out the shares of current demand for each asset category, sub-category, material and application (e.g. Infrastructure > Roads > Other non-metallic minerals > Roadstone).
The model structure was limited to these three principal materials based upon a combination of data availability and ease of integration into UK TM. Although the construction sector uses a plethora of different materials, detailed production statistics and MFA are only available for a few. UK TM distinguishes eight industrial sectors and sufficient data was not available to disaggregate the relative share of production that serviced construction sector demand in some of these (e.g. ‘Chemicals’; ‘Non-ferrous metals’ and ‘Other industries’.) For iron and steel, cement and other non-metallic minerals, the share of overall production attributable to construction demand was based upon statistics from product manufacturers and MFA studies.
Baseline future demand for new infrastructure construction to 2050 was taken from projections within the Green Construction Board’s Low Carbon Routemap for the Built Environment (GCB, 2013), based upon long run trends in output by asset sub-category. Demand for new construction under the Shift demand and Transform demand scenarios was primarily determined by assumptions developed within the analyses of other energy service sectors (e.g. under the Transform demand scenario for transport it is assumed that no new road building takes place, therefore output for the asset sub-category of ‘Roads’ is set to zero in the corresponding construction sector model scenario).
In addition to changes in demand for new construction, an extensive list of mitigation options to reduce material demand arising from that construction was assembled. Each mitigation option was designated as suitable for particular combinations of asset categories, sub-categories, materials and applications as appropriate. For instance, changes in the design of steel railway track would be applied as a proportional reduction to ‘Infrastructure > Railways > Iron and steel > Rail’ within the model. For each scenario, a ‘Change’ and a final ‘Adoption rate’ was specified. The ‘Change’ represented the proportional reduction in material use that could be achieved by implementing the mitigation measure based upon the assembled evidence. Where differing potential levels of reduction were identified by different studies, the authors selected an option based upon expert judgement.
Once a full list of mitigation measures had been assembled ‘Change’ rates for all mitigation options were adjusted to ensure they were additive (e.g. if two options sought to reduce the same material application, the option offering the greater reduction was preferred and the second option was omitted to prevent duplication). The ‘Adoption rate’ represented the maximum practically achievable deployment given a high level consideration of other constraints (cost; availability of supply chains etc.) and was primarily based upon expert judgement. Adoption of each measure was assumed to increase on a linear trajectory until reaching the final ‘Adoption rate’ in 2050. Each mitigation measure was also classified according to the ‘Avoid’ / ‘Shift’ / ‘Improve’ typology discussed in the parent report (note that there are some differences in terms of how a mitigation measure is classified in the construction analysis, compared to the summary report). Some mitigation measures would arguably incur a mix of the three, but each measure was only assigned a single classification.
This modelling approach represents an improvement upon prior models of the construction sector (which were primarily based upon extrapolations from a small set of archetypes), but still suffers from a number of limitations, likely resulting in a substantial under-estimate of the combined mitigation potential within the sector. Principally, the limited number of materials considered in detail fails to capture the full extent of mitigation opportunities across the sector (particularly within other key materials such as plastics, brick and timber). The limited disaggregation of applications means that the potential of some mitigation measures will be over or understated as the precise intervention applies to a differing boundary (e.g. a mitigation measure may only apply to bridges but cement use is only distinguished for ‘bridges and tunnels’ collectively).
Some valuable mitigation measures identified in the literature review were excluded altogether owing to an inability to incorporate them into the model framework – for instance where reductions were only evaluated in terms of carbon emissions and not material or energy demand. This is a particularly acute problem for measures that would sequester carbon, for instance by increasing the size of the harvested wood pool in the built environment. Such a measure would not be identified as a reduction in energy demand within the sectors considered here, and is therefore excluded from the analysis, despite the potential climate change mitigation benefits. Furthermore, some interventions that were identified as generally having potential benefits were omitted where there was insufficient evidence to reasonably extrapolate across a full asset category or sub-category (e.g. uptake of certain novel scheming tools has been shown to lead to reductions in material demand on selected case studies, but no robust evidence base existed upon which to extrapolate those benefits across a broader array of schemes).
Similarly, general changes in design practice motivated by increasingly common interventions, such as the introduction of whole life carbon targets by clients, were not typically included as there is insufficient data to attribute any particular reduction rate to general interventions that may support a variety of different mitigation measures. Collectively these omissions likely result in a substantial under-estimate of the overall mitigation potential within the sector.
Combining results from construction and other industry
of the UK TM sectors (iron and steel, cement, and non-metallic minerals) are impacted by the analysis of both construction and other industry. For each of these sectors the proportion of output going to UK construction was estimated. This was used to scale the contributions from construction and other sectors for the reference case and each scenario. An overall indexed change in output for each of the UK TM sectors was then calculated.
Limitations
In addition to the limitations detailed above in regards to specific parts of the study the following, more general, limitations of the analysis exist:
- The wide range of materials and products manufactured by the UK industrial sector means evidence does not exist on the opportunities for resource efficiency to reduce the requirement for each of these. It is therefore likely that opportunities for further resource efficiency will emerge, that are not included in this analysis.
- The aggregation of sectors to align with the UK TM model means that some detail of the savings in materials and products (which have unique energy use in their production) is lost.
- Due to international trade the impacts of some strategies will be seen overseas, additionally resource efficiency strategies pursued overseas could have impacts on UK production, neither of these is included in the current assessment.
- Economic data is used to represent the production system and the resulting change in sector outputs in the resource efficiency analysis. This is due to both data availability and the difficulties in defining physical outputs in comparable units from diverse production sectors. Although economic data is often used in such analyses, inaccuracies will likely arise due to its use as a proxy for changes in physical output.
- The rebound effect is not considered. A significant improvement in energy efficiency or resource efficiency in production may increase demand for a product as costs reduce, indirect rebound effects may also lead to the savings due to efficiency strategies (energy and resource) causing increased demand elsewhere in the economy (Brockway et al. 2017, Wood et al. 2017).
Results
Figure 1 shows the impact of the resource efficiency strategies on the output of UK TM sectors from 2020-2050. This is shown as an indexed change against the reference scenario. The impacts of construction strategies are not included here.
The resulting change in demand for steel, cement, and other non-metallic minerals from the construction scenarios is tabulated in Table 1 and illustrated in Figure 2 below.
| Material | Reference | Shift demand | Transform demand |
|---|---|---|---|
| Cement | ↑ 51% | ↑ 38% | ↓ 26% |
| Iron and steel | ↑ 64% | ↑ 45% | ↓ 19% |
| Other non-metallic minerals | ↑ 37% | ↑ 27% | ↓ 48% |
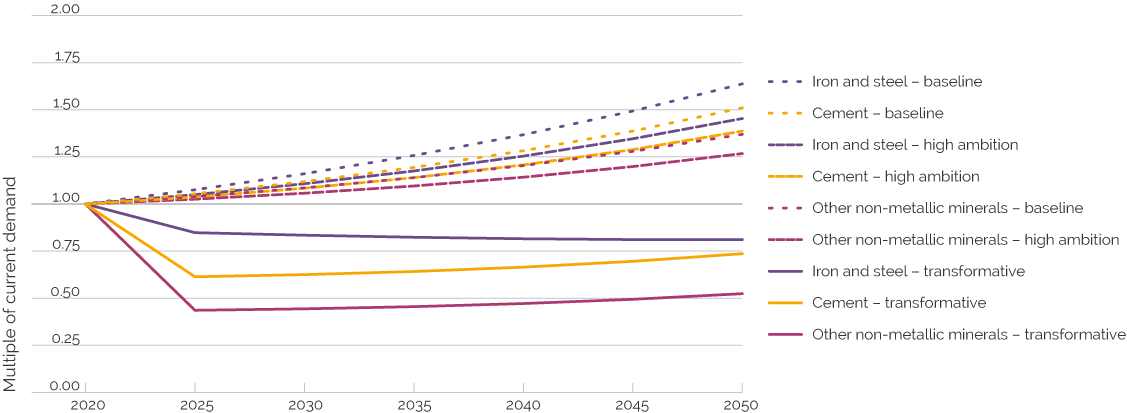
The primary driver of reductions in this sector is ‘Avoid’, reflecting the limited scope for reducing the use of certain key materials in specific applications. Though there are some options to make reductions through a ‘shift’ to alternate materials and ‘improve’ production processes (e.g. through the use of modern methods of construction); the primary means of reducing energy demand from construction is to reduce the overall demand for new buildings and infrastructure. Consequently the assumptions determining required future levels of service demand and their means of delivery (e.g. mobility delivered with no new roads due to reduced demand and modal shift) have a much larger collective impact upon demand for construction materials, than the combined suite of mitigation measures.
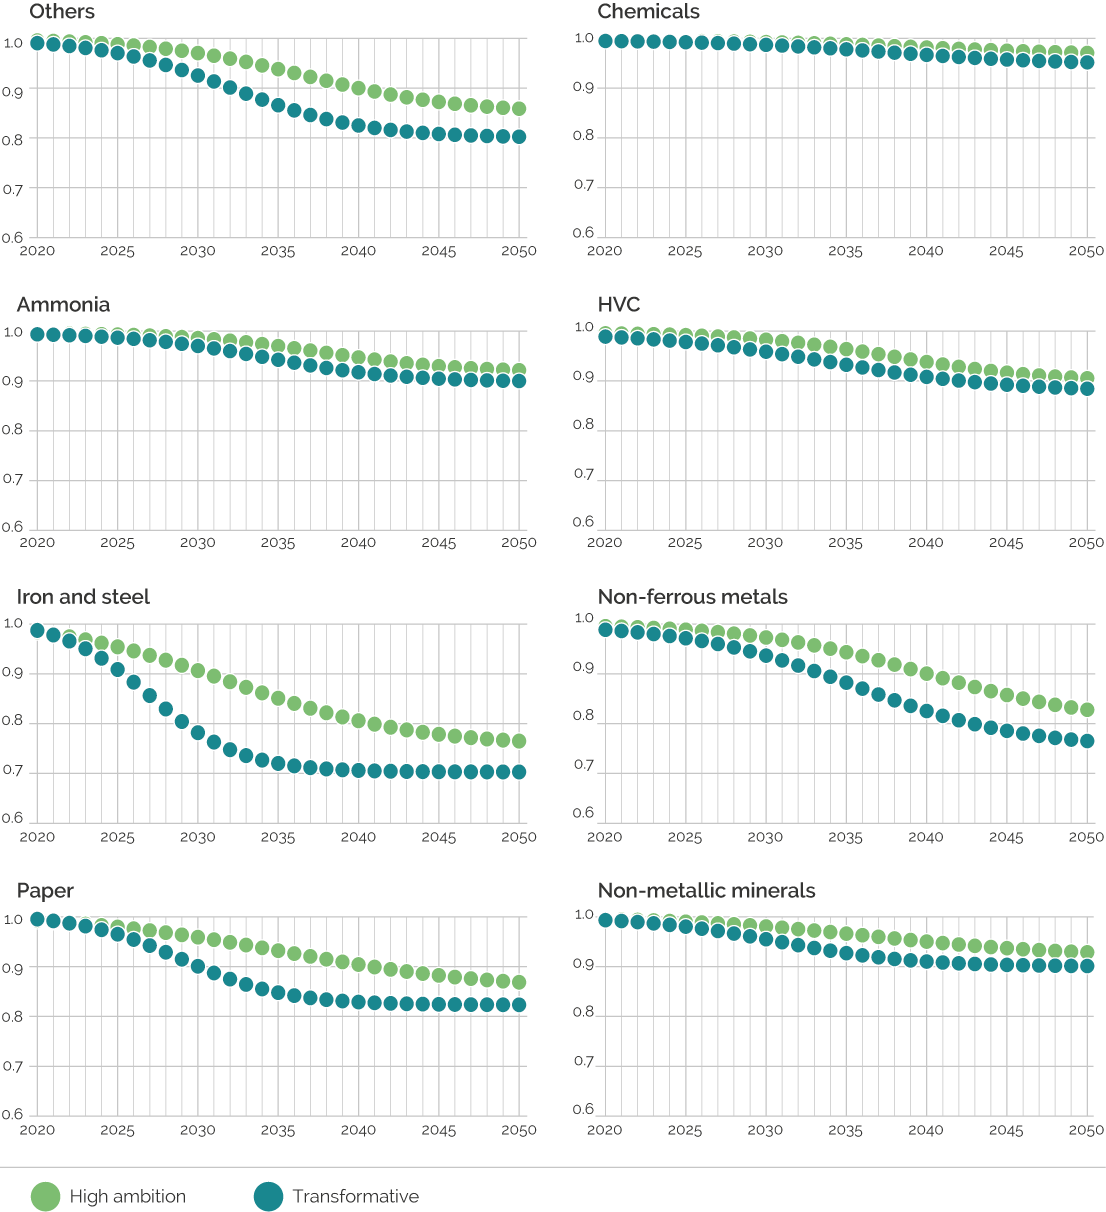
Table 2 shows the combined effect of the construction scenarios and resource efficiency strategies on the output of UK TM sectors, indexed to output in 2020.
| UK TM sector | Demand | 2020 | 2025 | 2030 | 2035 | 2040 | 2045 | 2050 |
|---|---|---|---|---|---|---|---|---|
| Iron and steel | Reference | 1.00 | 0.98 | 0.97 | 0.96 | 0.95 | 0.95 | 0.96 |
| Shift | 1.00 | 0.92 | 0.86 | 0.80 | 0.76 | 0.74 | 0.74 | |
| Transform | 1.00 | 0.83 | 0.68 | 0.61 | 0.57 | 0.55 | 0.53 | |
| Non-ferrous metals | Reference | 1.00 | 0.91 | 0.85 | 0.78 | 0.73 | 0.67 | 0.62 |
| Shift | 1.00 | 0.90 | 0.82 | 0.74 | 0.65 | 0.58 | 0.52 | |
| Transform | 1.00 | 0.89 | 0.79 | 0.69 | 0.60 | 0.53 | 0.48 | |
| Cement | Reference | 1.00 | 1.06 | 1.12 | 1.20 | 1.28 | 1.39 | 1.51 |
| Shift | 1.00 | 1.04 | 1.09 | 1.14 | 1.21 | 1.29 | 1.39 | |
| Transform | 1.00 | 0.63 | 0.65 | 0.66 | 0.69 | 0.72 | 0.76 | |
| Non-metallic minerals | Reference | 1.00 | 1.04 | 1.09 | 1.15 | 1.21 | 1.29 | 1.38 |
| Shift | 1.00 | 1.02 | 1.05 | 1.07 | 1.10 | 1.14 | 1.20 | |
| Transform | 1.00 | 0.55 | 0.54 | 0.53 | 0.53 | 0.55 | 0.58 | |
| Chemicals-HVC | Reference | 1.00 | 0.96 | 0.96 | 0.95 | 0.96 | 1.00 | 1.04 |
| Shift | 1.00 | 0.96 | 0.94 | 0.92 | 0.90 | 0.92 | 0.94 | |
| Transform | 1.00 | 0.94 | 0.92 | 0.89 | 0.87 | 0.89 | 0.92 | |
| Chemicals – ammonia | Reference | 1.00 | 0.96 | 0.96 | 0.95 | 0.96 | 1.00 | 1.04 |
| Shift | 1.00 | 0.96 | 0.95 | 0.92 | 0.91 | 0.93 | 0.96 | |
| Transform | 1.00 | 0.95 | 0.93 | 0.90 | 0.88 | 0.90 | 0.93 | |
| Chemicals – other | Reference | 1.00 | 0.96 | 0.96 | 0.95 | 0.96 | 1.00 | 1.04 |
| Shift | 1.00 | 0.96 | 0.95 | 0.94 | 0.95 | 0.98 | 1.01 | |
| Transform | 1.00 | 0.96 | 0.95 | 0.93 | 0.93 | 0.96 | 0.99 | |
| Paper | Reference | 1.00 | 0.92 | 0.84 | 0.77 | 0.72 | 0.67 | 0.63 |
| Shift | 1.00 | 0.89 | 0.80 | 0.72 | 0.65 | 0.59 | 0.55 | |
| Transform | 1.00 | 0.88 | 0.75 | 0.65 | 0.59 | 0.55 | 0.52 | |
| Other | Reference | 1.00 | 1.01 | 1.01 | 1.02 | 1.03 | 1.05 | 1.06 |
| Shift | 1.00 | 1.00 | 0.98 | 0.96 | 0.93 | 0.91 | 0.91 | |
| Transform | 1.00 | 0.98 | 0.94 | 0.88 | 0.85 | 0.85 | 0.85 |
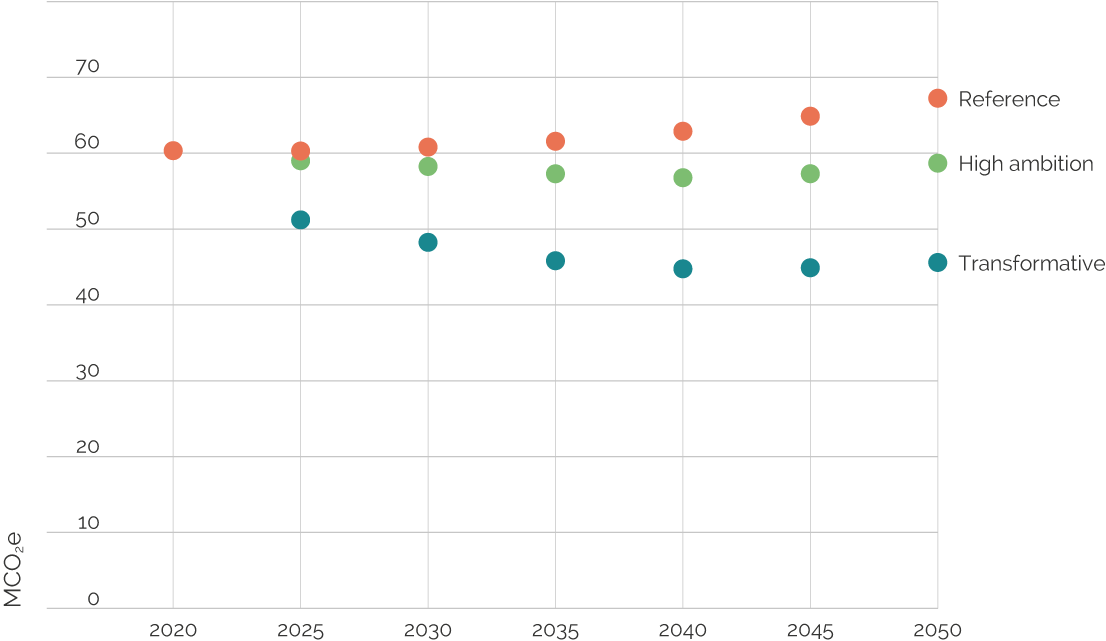
Figure 3 shows the combination of resource efficiency and construction strategies on emissions from materials and products with the intensity of production of each sector held constant at 2015 values. In 2050 this represents a 13-32% reduction from the reference case in the Shift demand and Transform demand scenario respectively. This does not include improvements in the production process and so gives an indication of the savings from resource efficiency and construction strategies in isolation.
References
Brockway, P.E., Saunders, H., Heun, M.K., Foxon, T.J., Steinberger, J.K., Barrett, J.R. and Sorrell, S. 2017. Energy rebound as a potential threat to a low-carbon future: findings from a new exergy-based national-level rebound approach. Energies, 10 (1): 51. doi: 10.3390/en10010051
CCC 2020. The Sixth Carbon Budget. The UK’s path to Net Zero. London: Committee on Climate Change.
Griffin, P., Hammond, G. and Norman, J. 2013. Industrial energy use from a bottom-up perspective: developing the usable energy database (beta version). Report No. UKERC/WP/ED/2013/002. London: UK Energy Research Centre.
Griffin, P., Hammond, G. and Norman, J. 2016. Industrial energy use and carbon emissions reduction: a UK perspective. WIRES Energy and Environment, 5 (6): 684–714. doi: 10.1002/wene.212
Meyer, P.S. 1994. Bi-logistic growth. Technological Forecasting and Social Change, 47 (1): 89-201. doi: 10.1016/0040-1625(94)90042-6
Owen, A., Brockway, P., Brand-Correa, L., Bunse, L., Sakai, M. and Barrett, J. 2017. Energy consumption-based accounts: A comparison of results using different energy extension vectors. Applied Energy, 190: 464–473, doi: 10.1016/j.apenergy.2016.12.089
Scott, K., Giesekam, J., Barrett, J. and Owen, A. 2019. Bridging the climate mitigation gap with economy-wide material productivity. Journal of Industrial Ecology, 23 (4): 918–931. doi: 10.1111/jiec.12831
Wood, R., Moran, D., Stadler, K., Ivanova, D., Steen-Olsen, K., Tisserant, A. and Hertwich, E. 2017. Prioritizing consumption-based carbon policy based on the evaluation of mitigation potential using input-output methods. Journal of Industrial Ecology, 22(3): 540–552. doi: 10.1111/jiec.12702
Construction
GCB 2020. Zero avoidable waste in construction, pdf. Technical Author: Adams, K. Eds: Pearce, R. and Thornback, J., Construction Products Association.
GCB 2013. Low carbon routemap for the UK built environment. Construction Leadership Council (CLC).
Giesekam, J., Barrett, J., Taylor, P.G. and Owen, A. 2014. The greenhouse gas emissions and mitigation options for materials used in UK construction. Energy and Buildings, 78: 202–214. doi: 10.1016/j.enbuild.2014.04.035
Giesekam, J., Barrett, J. and Taylor, P. 2016. Construction sector views on low carbon building materials. Building Research & Information, 44 (4): 423–444. doi: 10.1080/09613218.2016.1086872
A full list of references for mitigation measures and model data sources is available as supplementary information on request.
Appendix
| MRIO sector | SIC(07) definition | UK TM industry sector |
|---|---|---|
| Tobacco products | 12 | Others |
| Textiles | 13 | Others |
| Wearing apparel | 14 | Others |
| Leather and related products | 15 | Others |
| Wood and of products of wood | 16 | Others |
| Paper and paper products | 17 | Paper |
| Printing and recording services | 18 | Others |
| Paints, varnishes etc | 20.3 | Others |
| Soap and detergents, cleaning and polishing preparations, perfumes and toilet preparations | 20.4 | Chemicals |
| Other chemical products | 20.5 | Chemicals |
| Industrial gases, inorganics and fertilisers (all inorganic chemicals) – 20.11/13/15 | 20.11/13/15 | Ammonia |
| Petrochemicals – 20.14/16/17/60 | 20.14+20.16+20.17+20.6 | HVC |
| Dyestuffs, agro-chemicals – 20.12/20 | 20.12+20.2 | Chemicals |
| Basic pharmaceutical products and pharmaceutical preparations | 21 | Chemicals |
| Rubber and plastic products | 22 | Others |
| Manufacture of cement, lime, plaster and articles of concrete, cement and plaster | 23.51, 23.52, 23.6 | Cement |
| Glass, refractory, clay, other porcelain and ceramic, stone and abrasive products – 23.1-4/7-9 | 23.1-4 & 23.7-9 | Non-metallic minerals |
| Basic iron and steel | 24.1-3 | Iron and steel |
| Other basic metals and casting | 24.4-5 | Non-ferrous metals |
| Weapons and ammunition | 25.4 | Others |
| Fabricated metal products | 25.1-3+25.5-9 | Others |
| Computer, electronic and optical products | 26 | Others |
| Electrical equipment | 27 | Others |
| Machinery and equipment n.e.c. | 28 | Others |
| Motor vehicles, trailers and semi-trailers | 29 | Others |
| Ships and boats | 30.1 | Others |
| Air and spacecraft and related machinery | 30.3 | Others |
| Other transport equipment – 30.2/4/9 | 30.2+4+9 | Others |
| Furniture | 31 | Others |
| Other manufactured goods | 32 | Others |
| Repair and maintenance of ships and boats | 33.15 | Others |
| Repair and maintenance of aircraft and spacecraft | 33.16 | Others |
| Rest of repair | 33 (not 33.15-16) | Others |
Citation
Norman,J, Scott, S. and Giesekam, J. 2021. The role of energy demand reduction in achieving net-zero in the UK: Materials and products. Centre for Research into Energy Demand Solutions. Oxford, UK.