
3 Our approach
Reading time: 58 minutes
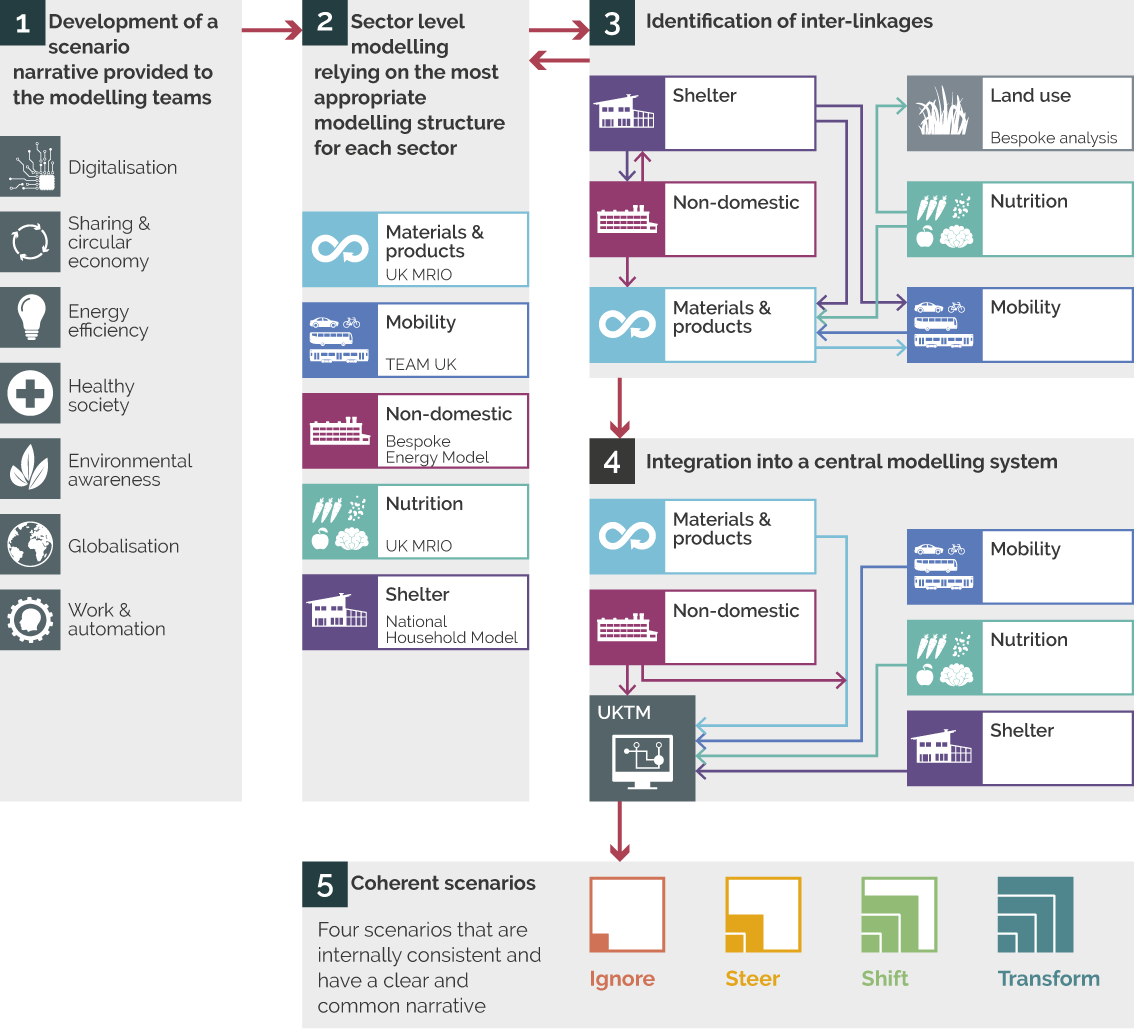
This section outlines the scenario and modelling approach that we adopted to construct our low energy demand (LED) scenarios. Each of these stages is summarised below and further information is given in each section.
- Co-create a scenario narrative – see section 3.1
- Devise coherent scenarios – see section 3.2
- Bottom-up energy service demand modelling for two low energy demand scenarios – see section 3.3
- Comprehensive economy wide scenarios developed in UK TIMES Model (UKTM) – see section 3.4
Figure 3 provides a visual representation of the modelling approach employed to develop our scenarios.
3.1 Scenario approach
Some modelling approaches are designed to provide a “prediction” or “forecast” of the future. That is not the case with our analysis; rather we are creating “simulations” of potential futures based on a well-developed narrative written by experts across a range of disciplines and fields. This narrative is then used to inform a bottom-up analysis of energy service demands in each sector, which are then used in an economy-wide model to construct “net-zero” scenarios for the UK. Our scenario approach is attempting to give insights into the possible scale of change in energy demand and GHG emissions under certain circumstances. Considerable effort has been made to ensure that the scenarios are internally consistent (see section 3.3.6).
We have developed four scenarios:
- S1 – Ignore demand Identifies levels of energy demand up to 2050 based on current known and planned UK Government policy instruments
- S2 – Steer demand Maintains energy service demands but has the goal of reducing emissions to net-zero by 2050
- S3 – Shift demand Significant shift in the attention given to energy demand strategies providing an ambitious programme of interventions across the whole economy describing what could possibly be achieved with existing technologies and current social and political framings.
- S4 – Transform demand Considers transformative change in technologies, social practices, infrastructure and institutions to deliver both reductions in energy but also numerous co-benefits such as health, improved local environments, improved work practices, reduced investment needs, and lower cumulative GHG emissions.
Scenario 3 and 4 assume a national effort to rapidly reduce energy demand in the UK to increase the opportunity of meeting ambitious climate outcomes in the short and long term. Our scenarios provide an analysis of the total final energy demand in the UK and are also broken down into the five high level categories of mobility, residential buildings, non-domestic buildings, nutrition, and materials and products. For nutrition, the analysis has been extended beyond energy demand to consider the non-CO2 GHG emissions associated with livestock. This allows us to give a more comprehensive assessment of the GHG emissions associated with our scenario. Descriptions of definitions of the sectors are given in section 3.3.
Historically, strategies to reduce energy demand have focused largely on improving energy efficiency over options to reduce demand for energy services or to change the way that services are delivered. This unnecessarily limits options whilst also failing to consider the underlying drivers of energy demand and the connection between energy efficiency and the economy. Rebound effects created by energy efficiency improvements have been shown to occur a) directly, with lower prices allowing for increased energy consumption, b) indirectly, with increased consumption of other energy services, and c) on an economy-wide scale, by stimulating economic growth (Sakai et al 2019). As there are also limits to the technical potential of efficiency improvements, particularly in energy intensive industrial processes (Cooper et al 2017), it is important to consider other demand side strategies alongside energy efficiency.
Creutzig et al.’s demand-side assessment framework (Creutzig et al 2018), adopted by the IPCC, can be used to identify a broader range of strategies to reduce energy demand.
Through this framework, we can avoid unnecessary energy services (e.g. reducing the need to travel), shift to the lowest intensity mode to deliver a service (e.g. modal shift from car to public or active transport), and improve energy efficiency. Each of these strategies can be applied to a range of energy services.
Before quantifying the energy demand for the individual sectors, we developed a scenario narrative to ensure consistency across our two LED scenarios, similar to the approach adopted in Grubler et al (2018). This shared vision is applied across all of the different energy using sectors. They include a number of principles that ensure that our scenario is both transformative but also within the realms of possibility. What is “possible” is, of course, very difficult if not impossible to define. Therefore, the set of principles are broad enough to take into account that predicting technologies, social practices and behaviours in 2050 is highly problematic. It is important to remember that we are creating possible futures in the form of scenarios and not a prediction of the future.
3.2 Low energy demand scenario narratives
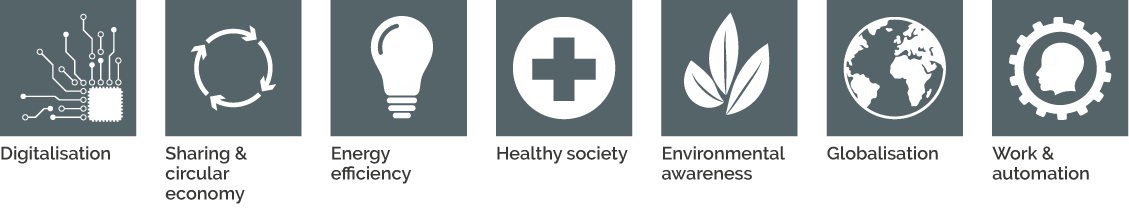
Whilst there are many observable societal, political, economic, scientific or philosophical trends that may impact transitions to low carbon societies, this section identifies seven observable underlying trends that have impacted upon energy demand, and/or are likely to continue to do so throughout the scenario timescale. This list is not exhaustive, as various other trends may impact on energy demand, such as demographic changes. These seven trends are captured in Figure 4. We recognise that there is considerable crossover between the various trends. We also recognise that some of these trends have the potential to both increase and reduce further energy demand (Brugger et al 2021).
 3.2.1 Digitalisation
In the context of our scenario, digitalisation is the integration of digital systems and information and communications technology (ICT) into the energy system. It is already driving significant changes in the energy sector and is likely to accelerate change in the future by promoting new energy business models through to changing how consumers interact with energy services (Rhodes 2020). Integrating ICT into the household and workplace energy systems and supply infrastructures will improve the capturing and use of energy system data. This will enable energy service providers to better understand consumption patterns, and more efficiently meet user’s needs (Grubler et al., 2018). The benefits of digitalisation also extend to consumers. Increased use of smartphones in managing energy services extend control and interactivity to the consumer, opening the potential for increased efficiency of consumption of energy in the household. Further, digitalisation has the potential to substitute material goods with digital equivalents, such as books or music (Court and Sorrell 2020).
However, it is worth noting that increased digitalisation will not necessarily bring about a reduction in energy demand. Lange et al (2020) identify four impacts of digitalisation on energy demand. Whilst digitalisation was found to facilitate efficiency increases with the potential to reduce energy demand, they highlight the potential for rebound effects. These include the potential to foster economic growth and the embodied energy within the production of ICT, that may both bring about increases in demand (Lange et al., 2020). This potential rebound effect is reiterated by others in the literature (Court and Sorrell, 2020; Noussan and Tagliapietra 2020). In the mobility services context, Noussan & Tagliapietra (2020) suggest that avoiding increased energy demand due to rebound effects requires policies that ensure optimised and shared use of energy services and technologies.
Thus, whilst digitalisation has the potential to improve user information and control, find efficiency savings in the supply and use of energy, support sustainable sharing business models, and improve quality of life, active policy is likely needed to ensure these amount to a reduction in energy demand.
In the LED scenarios developed in this study, digitalisation is applied to a range of energy services to reduce demand, such as energy management systems to extend control and avoid unnecessary consumption and mobility services to promote shared travel and reduce private consumption.
 3.2.2 Sharing and circular economy
The ‘sharing economy’ is an approach that aims to decrease the number of under-utilised ‘owned’ assets in an economy, by creating new business models that offer a service in its place (Grubler et al., 2018). Decreasing the overall demand for under-utilised products reduces the energy demanded for their production. A prominent example of the potential of the shared economy is in mobility. Shared vehicles such as car clubs or cycle hire offer the ability to rent vehicles as and when they are needed, replacing private ownership (Marsden et al 2019). For example, car clubs have been found to reduce the private ownership of vehicles by 10.5 cars for every car club car in use (Carplus 2016, pdf). A second strategy, shared trips, increases utilisation by filling empty seats with passengers who would otherwise have travelled alone (such as those facilitated by ride sharing websites such as Liftshare or BlaBlaCar) (Marsden et al., 2019). Sharing or use-based strategies that increase utilisation can be applied to other areas such as use of office buildings or shared use of consumer goods (Grubler et al., 2018).
Mobility sharing platforms, office sharing and hot-desking, and shared consumer electronics and appliances are all areas where shared economy approaches are applied in the LED scenarios developed in this study. It is worth noting that in some sectors there are trends towards less sharing, for example increased life expectancy and divorce rates have resulted in lower building occupancy, increasing heating and appliance use per person.
The sharing economy is closely linked to the concept of “circular economy”. Circular economy is a concept that explores resource efficiency strategies to extend the time that resources are retained in the economy, to reduce material throughput and environmental impacts (Cooper et al., 2017; Scott et al 2019; Hahladakis et al 2020). The term has become popular in policy discourses, with the European Commission and UK Government exploring legislation that promote circular economy strategies (Defra 2013, pdf; European Commission 2015). Circular economy approaches aim to reduce the flows of virgin material entering the system. These include a broad scope of strategies including: eco-design and production (ensuring waste materials can be recovered throughout the lifecycle), circular consumption (repairing and reuse aimed at increasing the use life of products), and developing new business models that increase the utilisation of products (Cooper et al., 2017; Grubler et al., 2018). These circular economy approaches have the potential to reduce the energy demanded to extract and produce virgin material, and lower the demand for new products through increased use-life.
 3.2.3 Energy efficiency
Despite an improvement of 1% annually in energy efficiency over the last 30 years (Lees and Eyre 2021), there is no indication that the potential for energy efficiency is anywhere near saturated. Globally, the overall conversion efficiency of primary energy into useful services is estimated to be approximately 15% (Cullen et al 2011; TWI2050 2018). Whilst the economic potential is lower, historically innovation has tended to increase the cost effective potential at a similar rate to its uptake, so that a 20-30% economic potential has existed for many decades (National Academy of Sciences et al 2010).
The LED scenarios assume realistic levels of continued energy efficiency gains. For example, we assume further efficiency gains in many appliances, but also recognise this requires a substantial shift in technology in some cases. In other cases, notably building retrofit, the potential is large with existing technology. The principal constraints are usually supply chain practices and consumer engagement rather than technological innovation. We recognise the role of information technology as an enabler of reduced energy demand and the continuing innovation of such a fast-moving industry. The increased digitalisation of society offers new opportunities to control energy demand through increased functionality (sensors, wireless controls, etc.) in buildings, transport and industry.
The most important driver of future energy efficiency improvement is likely to be the wider energy transition. As energy supply shifts progressively from fossil fuels to primary electricity, not only are the conversion losses in thermal electricity generation avoided, but more efficient end use is enabled. In particular, there are huge potential benefits in the electrification of the two largest end uses of energy – building heating and light vehicles.
In each case, a factor of three in energy efficiency improvement can be achieved relatively straightforwardly, through replacing boilers with heat pumps and internal combustion engine vehicles with electric vehicles. In the longer term, similar effects are likely in a number of industrial processes, including steel and ammonia. These effects alone can reduce UK final energy demand by 30% (Eyre, 2019) and constitute the main driver of energy demand reduction in our scenarios.
 3.2.4 Healthy society
It has been estimated that a scenario which meets the Paris Agreement and explicitly takes steps to benefit health via reduced air pollution, improved diet and active travel can result in 144,312 avoided UK deaths in 2040 compared to existing NDCs (Hamilton et al 2021). For comparison, 20,830 deaths with Covid-19 mentioned on the death certificate occurred in 2020 in England and Wales (Appleby 2021).
The scenarios developed in this study build upon an underlying trend of an increasing focus on health, wellbeing and quality of life, at the policy level and by individuals. The context of the Covid-19 pandemic brings this attention on healthy environments and lifestyles into sharp focus. As a result, both of the LED scenarios developed ensure there is not a reduction in health, wellbeing or quality of life. This is possible because there is a significant overlap and interdependence between policy and behavioural trends that both seek to improve health and reduce demand. In the case of nutrition, almost half of those switching to less energy intensive, plant-based diets, cite health reasons as their primary motivation for doing so (Waitrose & Partners 2019, pdf).
Similarly, reducing average calorific intake would also improve national health, given the high prevalence of being overweight and obesity amongst UK citizens (NHS Digital 2019). With regards to mobility services, significantly increasing the amount of active travel (cycling, walking) used to make shorter journeys, both reduces energy demand and improves physical and mental health (Public Health England 2016, pdf). Moreover, shifting private car journeys to shared and active transport helps to reduce negative health impacts associated with inactive lifestyles and exposure to toxic air pollution in cities (WHO 2016; WHO 2018, pdf; Bull et al 2020). For homes, providing well-insulated dwellings reduce the costs for the millions of families living in the poverty in the UK to achieve an appropriate internal temperature. This is strongly linked to healthy living. Reduced nitrogen oxides (NOx) and particulate emissions associated with electric vehicles (EVs) and heat pumps (HPs) also have health benefits (Watts et al 2021). The scenarios developed here thus assume that health and wellbeing will become increasingly important to both individuals and policymakers in light of the global pandemic. This societal priority is reflected in the significant wellbeing benefits of the scenarios developed.
 3.2.5 Increasing environmental awareness
As climate and ecological breakdown accelerates and significant climate impacts of events such as wildfires and flooding gain global attention, public concern for the environment grows across the globe. In the UK context, in January 2020 (before the Covid-19 pandemic), the environment ranked in the top three issues facing the country for over 30% of the British public (YouGov 2021). This high point of environmental awareness largely correlates with the notable rise in high profile climate activism during 2019 (YouGov, 2021). Whilst during the Covid-19 pandemic, public concern relative to other issues has fallen, a quarter of views captured still suggest the environment is a significant issue. As captured by opinion polling and academic studies, at the beginning of the last decade environmental awareness and concern about the climate was relatively low, suggesting increasing environmental concern is a significant trend (Pidgeon 2012; YouGov, 2021).
Increasing environmental awareness and concern about the climate crisis is already having impacts on the demand for energy services. For example, in nutrition, there is a significant trend towards reducing meat consumption in diets. Whilst the empirical data on national spread of diets is poor, several market surveys have suggested the number of vegetarians has vastly increased in the last five years (YouGov 2017; Waitrose & Partners, 2019; Finder UK 2021). Some estimate that up to 33.5% of the population are reducing or cutting out meat from their diets (Waitrose & Partners, 2019), although this has yet to materialise in reduced UK meat consumption (Norton 2020). Further, Waitrose (2019) report that for 38% of those going vegan or vegetarian, concern for the environment is the most significant motivation. There is further evidence that this trend may continue into the future. Bryant (2019) highlights that even amongst meat-eaters, over 70% have a positive view of the environmental benefits of a plant-based diet. This evidence suggests that increasing environmental concern can lead to significant changes in social practices and demand for energy services.
In our LED scenarios it is assumed that concern over the environment and promotion of appropriate actions to reduce energy demand, as well as concerns regarding health, quality of life and energy use continue to drive social change. Given the inevitable worsening impacts of the climate crisis, and the already increasing trend of environmental awareness, social norms are assumed to shift to favour sustainable consumption of energy services.
 3.2.6 Globalisation
Increasing globalisation in the form of international production networks and global value chains has a wide range of impacts on national final energy demand in different countries (Shahbaz et al 2018). Studies focusing on the environmental impacts of globalisation have indicated that around 25% of global CO2 emissions are embodied in global trade flows (Andrew and Peters 2013). The energy intensity of globalised supply chains highlights a potential conflict between increased globalisation in this sense, and reductions in global energy demand. Of these emissions transferred between countries in trade flows, most are embodied in products consumed by ‘developed’ countries (Davis and Caldeira 2010; Davis et al 2011; Meng et al 2018). This indicates that most developed countries, such as the UK, are net-importers of emissions and embodied energy in the products they consume, a trend that is growing over time (Meng et al., 2018).
In the UK context, final energy consumption declined by 11% between 2001 and 2013 (Hardt et al 2018). However, Hardt et al. (2018) contextualise this trend with respect to the ongoing structural change occurring in the UK economy. They suggest that the most significant contributor to energy savings made through structural change are as a result of offshoring energy intensive production, available due to cost-effective global production networks and value chains (Hardt et al., 2018). This finding presents a distinction between reductions in domestic final energy demand (and territorial GHG emissions) that make a genuine contribution to mitigating climate change, and instances where reductions in domestic final energy demand (and territorial emissions) are caused by offshoring emissions to other regions, thus failing to contribute to climate change mitigation.
Understanding how globalisation can impact upon domestic and global energy demand is therefore important to ensure energy demand and emissions are not exported elsewhere. While our analysis of energy demand is from a territorial perspective, the LED scenarios developed here reflect genuine energy demand reductions that do not increase reliance on imports of highly energy-intensive products from abroad.
 3.2.7 Work and automation
There are many overlaps between trends involving the increased digitalisation, as discussed previously, and automation of social and economic activity, such as the integration of machine learning and artificial intelligence into energy service provision (Rhodes 2020). However, this trend considers the distinct impact that automation may have on working patterns in the UK, and how this may change the demand for energy services. As Graeber (2013) recounts, in 1930, John Maynard Keynes predicted that early industrialised wealthy countries such as the UK or USA would be working 10–15 hours in an average working week by the beginning of the 21st century due to significant advances in the productive capacity of technology. Technologically speaking, this prediction is not too far removed from reality. Several studies have aimed to assess how many jobs could be replaced by automation. Frey and Osborne 2013 indicate that 47% of jobs in the US are at a high risk of being displaced by automation. In the UK context, several studies have suggested that 30% of UK jobs were vulnerable to automation, whilst the Office for National Statistics (ONS) suggests 7.4% of jobs are at high risk of automation, with 65% of jobs at a medium risk (ONS 2017; BEIS Parliamentary Committee 2019, pdf).
So whilst the productive capacity of autonomous technology can reduce the need for labour, the average full time working week over the past 20 years remains stable at around 38 hours per week (ONS 2021). The stability of working time suggests that increasing integration of autonomous technology is not having a significant impact on working time. Whilst the stability of average hours worked is the result of multiple factors, it is partially explained by the need for increasing labour productivity to underpin growth-based business and economic models (Schor, 1992). This indicates that if prioritised, it is feasible that working less could be supported by increasing automation (Stronge and Harper 2019, pdf).
3.2.8 Summary of key assumptions
The following list maps scenario drivers across sectors.
Digitalisation
Nutrition
- New technologies would allow optimisation within the UK food supply chain to reduce food waste and deliver goods more efficiently.
- Increased online shopping improves sector efficiency.
- Nutrition tracking technologies at the consumer end also have a role in moderating calorie intake.
- Apps and other IT-enabled services currently allow redistribution of excess food, reducing food waste.
Mobility
- Increased use of digitalised technology improves logistics for freight transport.
- Greater use of video conferencing.
- Greater integration of urban transport networks, including through digitalised timetabling and ticketing.
- Lower car ownership and lower levels of car license holding because of reductions in the need to travel.
Residential buildings
- Increased use of smart meters.
- Increased access to digitalised lighting controls, enabling energy savings whilst out of the house.
- Increased integration of other ‘smart’ technology, extending greater control over domestic energy use to consumers.
Non-domestic buildings
- Implementation of digital building system control systems.
Materials and products
- Increased use of online second-hand market platforms in clothing and textiles, packaging, vehicles, electronics, appliances and machinery and furniture.
- Digital industrial symbiosis programs to enable the exchange of materials between industries.
- Increased use of digital tools enabling design optimisation to reduce life cycle impacts of construction.
Sharing and circular economy
Nutrition
- Reduction in food wasted by businesses and households.
Mobility
- Willingness for car-sharing to reduce single occupancy car use.
- Lower car ownership and lower levels of car license holding because of reductions in the need to travel.
Residential buildings
- Increased household occupancy reduces the need for new home construction.
- Expansion of co-housing.
Non-domestic buildings
- Office sharing and hot-desking reduces the need for new non-domestic buildings.
Materials and products (Industry)
- Increased use of online second-hand market platforms in clothing and textiles, packaging, vehicles, electronics, appliances and machinery and furniture.
- Increased car sharing reduces the consumption of new vehicles and the demand for the respective manufacturing materials.
- Waste reduction across key impact sectors through extension of lifetimes, material substitution in clothing and construction and increased ability of products to be repaired.
Energy efficiency
Nutrition
- Centralised retail and distribution (i.e. warehouse retailing and home delivery, without supermarkets) lead to efficiency improvements.
Mobility
- Switch of all non-HGV road transport to electric, yielding significant energy efficiency improvements.
Residential buildings
- Retrofitting of electric heat pumps, and improved insulation yield significant energy efficiency improvements.
- Energy efficiency improvements from mandatory use of light emitting diode (LED) lighting.
Non-domestic buildings
- Increased implementation of energy management systems, building retrofit, building system control, ventilation and cooling, and more efficient energy using technologies.
- Energy efficiency improvements from mandatory use of light emitting diode (LED) lighting.
Materials and products (Industry)
- Implement remaining energy efficiency options across UK industry.
- Replacement of inefficient technologies to facilitate low carbon fuel switching.
Healthy society
Nutrition
- Reductions in calorific intake improve health related issues associated with obesity.
- A reduction in the number of omnivores as a result of an increased consciousness of the health issues around excessive meat consumption.
- Nutrition tracking technologies at the consumer end also have a role in moderating calorie intake and promoting healthier diets.
Mobility
- Expansion of public and active travel networks facilitating increased exercise levels and reducing urban air pollution.
- Improvement in local air quality through implementation of low-traffic neighbourhoods.
Residential buildings
- Reducing fuel poverty creates a healthier living environment, while improving ventilation.
Non-domestic buildings
- Improved ventilation and cooling systems allow for a well-regulated working environment, limiting the spread of airborne viruses in the workplace.
Materials and products (Industry)
- Reduced levels of industrial pollution because of fuel switching.
Environmental awareness
Nutrition
- A reduction in the number of meat eaters as a result of an increased awareness of the environmental impact.
Mobility
- Public opinion allows limits to be placed on investments in aviation and road infrastructure.
- Less demand for aviation and road transport driven by an increased public awareness of the environmental damage.
- Public mandate to implement a taxation framework to reduce excessive travel demand, including multiple car ownership.
Residential buildings
- Increased environmental awareness and the greater amount of control over domestic energy use afforded by the integration of smart technology, facilitates a reduction in energy use.
- Households are more proactive in reducing energy use across the home, including in reducing heat.
Non-domestic buildings
- Net-zero commitments are made by an increasing number of companies, leading to greater uptake of energy efficiency improvements.
Materials and products (Industry)
- Increased environmental awareness helps to bridge the gap between the psychological obsolescence and technological obsolescence in clothing and textiles, vehicles, electronics, appliances, and furniture.
Globalisation
Nutrition
- Optimisation of international food supply chains reducing food waste.
Mobility
- Vertical integration across companies improves load factors for long and medium distance freight.
- Renewed push for consolidation centres around big cities and towns, reduces HGV miles travelled.
- Reduction in global aviation demand from UK passengers.
Materials and products (Industry)
- Optimisation of global supply chains for products that ensure consistent global standards.
Work and automation
Nutrition
- Increased availability of plant-based meals and reduction of meals containing meat in workplaces.
- Reduced domestic food waste as more people are eating at home as a result of home working.
- Apps and other IT-enabled services currently allow redistribution of excess food, reducing food waste.
Mobility
- Following the Covid-19 pandemic, new patterns of working are continued including increased working from home or teleworking, a greater use of video conferencing and a four-day working week.
Residential buildings
- Increased domestic energy use from higher levels of home working and the four-day working week are considered.
Non-domestic buildings
- Workplaces optimise work environments to reduce energy use.
- Office sharing and hot-desking reduces the need for new non-domestic buildings.
- Increased homeworking and teleworking reduce the need for office space.
- Increased use of video conferencing reduces the size of office space needed for large meetings or conferences.
3.3 Sectoral modelling of low energy demand scenarios
We outline in more detail how the above underlying trends translate into the two LED scenarios (scenarios 3 and 4) for the UK. These are labelled Shift demand and Transform demand. The Shift demand scenario describes a significant shift in the attention given to energy demand strategies providing an ambitious programme of interventions across all of our five sectors. It describes what could possibly be achieved with existing technologies and current social and political framings. At the same time the scenario still considers changing social-economic factors such as the changing nature of retail, businesses becoming increasingly accountable for their emissions, localisation and increased public acceptance to pay for environmental costs.
The Transform demand scenario reflects a much more transformative future, where more significant reductions are realised but under which quality of life is enhanced. To achieve substantial reductions in energy demand, decisions should be made by recognising the need for social-technical transitions. Energy efficiency alone is not the only driver available to affect energy demand. Our scenarios reinforce the Climate Change Committee’s (CCC) Sixth Carbon Budget, that suggests ‘behavioural’ and ‘technical’ solutions are imperative to meeting the UK’s climate ambition (CCC 2020b). Relying on technical solutions alone is insufficiently rapid and risky, and policies influencing the demand for energy services (e.g. transport) should have a more prominent role.
Energy demand is shaped by cultural norms, values, preferences and structural factors (Creutzig et al 2018). These practices are malleable and change over time leading to very different outcomes in relation to the UK’s demand for energy. Recent shifts in attitudes related to climate change and the declaration of climate emergencies demonstrate the possibility for rapid change meaning that there is a danger that scenarios constrained by current thinking can be outdated and irrelevant. To overcome this problem, this scenario attempts to consider transformative change in technologies, social practices, infrastructure and institutions to achieve a greater level of energy demand reduction beyond the Shift demand scenario.
A particular focus of the two LED scenarios is to consider strategies that both reduce energy demand but also maximise other social and economic benefits. These include healthy diets, active living, improved local air quality, quality housing and lowering the costs of the net-zero transition. The scenario sets out to demonstrate the benefits of recognising the many co-benefits associated with role of energy demand reduction.
In the rest of this section, we outline how we have considered the different narrative drivers in both LED scenarios. The modelling approaches used for each of the sector analyses are listed in Table 1.
| Sector | Modelling approach |
|---|---|
| Mobility | TEAM-UK (Transport Energy Air pollution Model for the UK) |
| Nutrition (including agriculture) | Hybrid UK MRIO (Multi-Regional Input Output model) |
| Shelter (domestic buildings) | UK National Household Model (NHM) |
| Non-domestic buildings | Bespoke model |
| Materials and products (industry) | Hybrid UK MRIO (Multi-Regional Input Output model) |
Please see the supplementary information that provides a separate report explaining in detail the modelling assumptions and approach used for each sector.
 3.3.1 Mobility
In the UK, road transport accounted for just under three quarters of transport energy consumption in the UK in 2019, with the remainder almost entirely from air travel (24%). Energy use in railways (2%) and shipping (2%) were relatively minor. Of the road component, energy use from cars accounts for more than half (61%), with most of the remainder coming from ‘light duty vehicles’ (vans) (17%), heavy goods vehicles (HGVs) (18%) and buses (3%).
Energy use from transport has increased by 16% since 1990 (6% since 2013) against a UK economy-wide decrease of 4% and remains 98% dependent on fossil fuels.
There has been little to no focus on reducing distance travelled; instead the focus has been first to ultra low emission vehicles (ULEVs), and then to zero-emission vehicles (ZEVs), primarily through electrification. However, the energy efficiency improvements have been more than lost mainly due to a continued swing towards larger passenger cars. This almost universal focus on improving energy consumption per passenger-km or tonne-km travelled ignores the other two core elements of the Avoid-Shift-Improve hierarchy.
The focus of the LED scenarios is to reduce energy demand for transport. This will be achieved through the three-pronged approach of reducing the need for energy services at the same time as improving efficiency (e.g. speed limits, EVs) and using an efficient decarbonised supply of energy. The need to travel will be reduced through better land-use planning, restrictions on car use in central, residential, and environmentally sensitive locations, and facilitating transfer of car trips to public transport, walking and cycling by reallocation of expenditures, street design, pricing and regulation. This allows for a policy perspective where reduced energy use does not run counter to quality of life but arises from measures designed to enhance it. Evidence suggests a lower rate of demand for passenger mobility is a necessary and a credible future, but that this would require a different policy package to ‘scale up’ and ‘lock in’ the new demand patterns, alongside new vehicle technology (Brand et al 2019).
Key assumptions for both LED scenarios include (see sector summary for details):
- No more substantial new road building or airport capacity expansion; some roads repurposed for shared, public and active mobility. No more development on greenfield sites.
- Integrated transport authorities in all urban/city regions (One network; one timetable; one ticket).
- Doubling investment in public transport, walking and cycling with the construction of high-quality cycling networks of segregated cycleways in all urban areas.
- Single occupancy car use becoming socially unacceptable and parking charges and infrastructure designed to encourage vehicle sharing. High taxation on more than one car per household.
- Eco-levy applied to the whole system – the more you travel and the more polluting modes you use, the more you pay – includes air travel (frequent flier levy).
- Car fleet is reduced substantially as driving licence uptake is down with transition to ‘car usership’.
- But taxi and shared fleets increase – all electric by 2030.
- Increase in light commercial vehicle (LCV) (van) fleet due to more online shopping – electric only sold from 2030.
- Large and heavy internal combustion engine (ICE), plug-in hybrid electric vehicle (PHEV) and hybrid electric vehicle (HEV) cars gradually phased out by 2030 and a substantially expanded bus fleet will be largely electric. Big investment in and standardisation of charging infrastructure across the nation.
- HGV – renewed push for consolidation centres around big cities and towns – reduced miles travelled.
- Road freight – much improved logistics, vertical integration e.g. Amazon – improves load factors for long and medium distance freight.
- No significant shift from road to rail freight, as rail capacity is largely taken up by net passenger rail increases (rail use for leisure rises, commuting and business use goes down).
Additional assumptions specific to the Transform demand scenario include (see sector summary for details):
- The phase out of ICE, PHEV and HEV cars is brought forward to 2025.
- Less demand for aviation driven by an increased public awareness of the environmental damage, higher costs for frequent flying, and increased fuel costs through taxation.
- Introduction of a four-day working week due to a greater focus on quality of life resulting in a 10% reduction in commuting trips per person by 2030 and further reductions by 2050.
- Increased reduction in commuting due to working at home or teleworking where industrial restructuring allows greater flexibility.
- Greater reliance on video-conferencing in businesses improving work-life balance.
- Lower car ownership levels, particularly in urban areas, in line with the “mobility” assumptions reducing the need to travel and a shift towards public transport, e-micro mobility and shared mobility.
 3.3.2 Nutrition
The CCC estimates that 11% of UK GHG emissions are attributable to agriculture and land use, and predicts that the sector will become a major emitter in 2050 (CCC 2018c). The food and drink industry also represents 7% of the UK’s industrial GHG emissions (Hammond 2018). As the ultimate driver of agricultural and related emissions, we consider how changes to the quantity and type of food demand could contribute to a UK low energy demand pathway by 2050.
We consider three key options for constraining energy demand in the sector, which cover each stage of the UK food system, and address the major current sources of inefficiency and emissions-intensity. The food system presents particular challenges in considering energy demand, given that non-energy emissions relating to land use change (LUC) and livestock (ruminant enteric fermentation) are more significant in the sector.
We consider the effect of calorific intakes being brought in line with Government Dietary Recommendations (i.e. healthy levels), and in reducing supply chain food waste. Calorific intake is the determinant of the volume of food demand per capita. The UK is challenged by overconsumption, with approximately 65% of the population of England estimated to be in ‘overweight’ or ‘obese’ BMI groups as of 2017 (NHS Digital 2017).
We also consider the role of reducing food waste and losses across the supply chain; this is a key public policy target, as cited in the recent Resources and Waste Strategy (HM Government 2018, pdf). It is also a means of avoiding additional food demand, by making more efficient use of the food that is currently delivered through the UK food system. As indicated by Bajželj et al (2014), food waste reduction is more effective downstream (i.e. closer to households) given the embodied energy demand of the product by that stage. This is therefore one of our core energy demand reduction strategies in the analysis.
We consider the role of dietary transitions to more sustainable food products. Approximately 18% of global GHG emissions are attributable to livestock production, with ruminants posing the largest single anthropogenic methane source, and occupying 25% of global land for grazing (Stehfest et al 2009). This scenario envisages a shift to plant-based diets as an extension of the recent trend for reduced meat consumption. From 2014 to 2018, the number of vegans in the UK is reported to have increased by 450,000. Of this number, 42% of vegans were reported to have switched to this diet during 2018 (The Vegan Society 2019). Finally, we consider the potential for greater agricultural and industrial efficiency, primarily through new or best practice technologies.
Our analysis is based on the detailed assessment provided by Garvey et al (2021) (see sector summary for details).
Key assumptions for the Shift demand scenario include:
- Calorific intake reduces from the current average of 3,154 calories for a UK adult to 2686 calories by 2050 thus improving health related issues associated with obesity.
- A reduction in the number of omnivores in the UK population from 66.5% today to 17% by 2050.
- An increase in the number of people adopting our “healthy diet” (see appendix for description) from 21% to 27% of the UK population.
- Percentage of vegetarians increases from 9.5% today to 36% by 2050.
- Percentage of the UK population adopting a plant-based diet increases from 3% to 20%.
- An annual reduction in avoidable food waste of 2.5% a year up to 2050.
Additional assumptions specific to the Transform demand scenario include:
- Further reduction in calorific intake to ensure that a healthy diet is taken up by all UK adults giving an average daily calorific intake of 2,500 calories as recommend by Public Health England.
- An increase in vegetarians by 2050 where they represent 42% of the UK population.
- An increase in plant-based diets by 2050 where they represent 25% of the UK population.
- An increase in the annual reduction of food waste to 3.33% per annum.
Key drivers of these scenarios:
- New technologies would allow optimisation within the UK food supply chain to reduce food waste and deliver goods more efficiently. Trends towards centralised retail and distribution (i.e. warehouse retailing and home delivery, without supermarkets) could contribute to energy demand reduction in the food sector, whilst creating new business structures for food retail.
- Nutrition tracking technologies at the consumer end also have a role in moderating calorie intake and promoting healthier diets. Information provision around embodied energy/emissions in food could also stimulate behaviour change in food buying.
- Apps and other IT-enabled services currently allow redistribution of excess food, reducing food waste.
- Greater demand for plant-based goods and vegetable proteins would create a market space and potential lower price for such products.
 3.3.3 Heat in domestic buildings
Residential buildings in the UK rely predominantly on heat produced from burning natural gas in boiler-based systems that are popular because they are well-known, considered responsive, reliable quiet and relatively cheap. As a result, in 2019, this sector was responsible for 69.2 Mt of direct carbon dioxide emissions (BEIS 2020a). This represented 15.2% of total national GHG emissions in that year, a share which has been increasing steadily since the 1990s – a relative increase due largely to the faster rates of decarbonisation seen in the power and industrial sectors as compared to residential buildings.
In parallel, the relatively poor thermal state of the housing stock in the UK has been the focus of frequent commentary with some stating that the country houses some of the worst performing buildings in Europe in efficiency terms (Maclean et al 2016, pdf). As a result, 84% of all the energy used in the residential sector goes to producing space and water heat, a share which has only decreased by two percent points since 1990 in part because the level and volume of homes heated has increased. Three quarters of this energy is used for space heating alone.
Reducing energy use in this sector has been the focus of national policy since 1970. Successful strategies have included regulating the use of efficient boilers and windows as well as new buildings, incentivising cavity and roof insulation, and efficient appliances (particularly lighting) plus rolling out supplier obligations to reduce the carbon content of services delivered, particularly to vulnerable households.
While these have incentivised energy efficiency, the rate has not always kept pace with increased demand for domestic energy services in part because this sector has been particularly impacted by stop-start policies which have demotivated the domestic energy efficiency refurbishment sector and not encouraged economies of scale. A recent report by the UK Energy Research Centre (UKERC) put this in starker terms noting that the UK needed to upgrade around 19,000 homes per week, compared to 3,800 seen in 2018–19; at current rates, this report suggests that the target, set out by the CCC, would take more than 700 years to reach. (Rosenow et al 2019). The UK government has set a goal of installing 600,000 heat pumps per annum by 2028 from the current base of 30,000 (UK Government, 2020). However, the policy instruments to deliver this have yet to be defined.
To include the residential sector, the LED scenarios use the UK National Household Model (NHM) to develop a detailed analysis of how the current and future housing stock can develop and what they can achieve. The NHM was developed and is currently still run by the Department for Business, Energy and Industrial Strategy (BEIS) and is an open source housing stock model that simulates the energy performance of buildings under different sets of technical and building use assumptions.
The measures included in each of the LED scenarios explore incremental levels of technical ambition applied across the housing stock. They look at faster, deeper, and more widespread roll-out of building fabric retrofits; consider more ambitious heat pump, hybrid heat, and solar hot water programmes; and assume different requirement levels for new build housing apply as energy and infrastructure use in other sectors change. By simulating these changes the NHM derives energy requirements across the building stock for space heating and hot water. These are aggregated to into building categories that fit the descriptions used in the whole systems model. Their change over time then form the basis for the annual growth rates that define the change in energy demand that the whole energy system model sees.
Key assumptions include:
- Fabric efficiency sees accelerated roll-out of building retrofits for existing stock reaching 250 k and 1 m measures per year in the Shift demand and Transform demand cases respectively.
- These changes are combined with increasing numbers of clean and highly efficient air and ground-source heat pumps. Hybrid systems forgo natural gas and rely instead on cleaner hydrogen or syngas. Gas boilers are phased out of existing buildings and excluded from new dwellings.
- As the scenarios explore deeper changes to society, the way in which we interact with and consider our residential buildings changes, for example:
The share of households practicing homeworking increases at a low, but steady pace. The Transform demand future goes further and considers a corresponding increase in a 4-day working week practice.
New build dwelling construction, while maintained in the Shift demand future, is reduced and replaced by repurposing non-domestic building space freed up by lower retail and office space needs.
Finally, smart systems help to change our building heating habits, maintaining quality of life while delivering heat only where and when it is needed.
 3.3.4 Non-domestic buildings
The non-domestic sector includes a complex mix of buildings with a wide variety of different uses, from purpose built retail and commercial spaces, through to storage and refrigeration, hospitality health, education, or public services. Over time, this patchwork sector has shifted, in emissions terms, in both importance and composition. Total GHG emissions have grown from 26 Mt CO2e (3.2% of UK territorial emissions) in 1990 to 30 Mt CO2e (6.7% of total) in 2019 (BEIS 2021a). In composition terms, the share of hydrofluorocarbon (HFC) emissions from cooling and refrigeration has progressed to represent 36% of the sector total; while a 40% reduction in public sector building emissions has left commercial and business buildings responsible for about 74% of total emissions in 2019.
In both the LED scenarios, the energy demand reductions take a two-pronged approach. On the one hand, they result from varying levels of ambition in rolling out energy efficiency measures detailed across the existing and future sector building stock. On the other, they rely on changes to the overall growth in non-domestic stock itself. The latter results from changes in the wider economy, e.g. reduced retail and office space requirements due to a move to online retail and homeworking, and leads to changes in growth expectations in non-domestic floor space.
The energy efficiency measure role out is based on assessing overall technical potential, using data from the Building Energy Efficiency Survey (BEES) (BEIS 2016b). This approach considers sector requirements in both electrical and natural gas, and assesses the potential for 13 measures to reduce overall sector demand when applied across the relevant building stock at a sub-sector level. These measures include energy management systems, building retrofit, building system control, ventilation and cooling, and more efficient appliances.
On floor space, the Transform demand scenario sees growth in storage counteracted by a reduction in office space leading total floor space to remain constant. Some of the reduction in office space assumes that a proportion of commercial units are retrofitted to flats for residential occupancy. Most other non-domestic building types remain flat, apart from limited growth in education and health in line with population. The Shift demand scenario sees almost a 40% increase in floorspace; despite some reductions in office, storage growth is much more pronounced, leading to an overall increase. This compares to just over 50% growth in the Ignore demand scenario.
Key assumptions include:
- Varying speeds in BEES measure implementation with rapid, and very rapid, uptakes for both LED scenarios, relative to slower adoption in the Ignore demand scenario.
- This means full deployment of all efficiency potential across most measures by 2040, with rapid roll-out during the 2020s.
- Building fabric assumed to realise full potential by 2050, with stronger roll out across the 2020s and 2030s.
- Switching to improved energy using devices for heating means large-scale switching to electricity, with the use of heat pumps (determined in UKTM).
- Floor space increases by only 2% in 2050, relative to 2020 in the most ambitious low energy case. This is largely due to reduction in office space counteracting an increase in storage facilities.
3.3.5 Lighting and appliances in domestic and non-domestic settings
Electrical appliances, cooking and lighting account for 19% of energy consumption in UK homes (CCC 2019b). While efficiency improvements in lighting and appliances have led to a fall in electricity demand in recent years, this is expected to be counteracted by increasing electrification, particularly of heat (CCC 2019a). Most existing research focuses on efficiency improvements as the main method of energy demand reduction in appliances. Scenarios tend to assume that the variety and usage of appliances will increase to 2050, however, in our Transform demand scenario, we consider the possibilities to reduce energy service demands where there is no reduction in quality of life.
Therefore, as well as considering energy efficiency we also considered the impacts of behavioural change to use appliances more efficiently and less often, and the potential to reduce the number of appliances per household without compromising quality of life. In some areas like cooking and refrigeration there is limited capacity to avoid energy consumption as these appliances deliver an essential service and most households only own one of each type of appliance. However, in other areas like lighting and consumer electronics, it is possible to reduce the amount an appliance is used without impacting quality of life.
New technologies such as smart meters and disaggregated electricity consumption data can also play a role in helping individuals reduce unnecessary consumption (Kelly and Knottenbelt 2016; BEIS 2019c, pdf).
Energy efficiency improvements in appliances have had the largest impact on energy demand in recent decades. Without efficiency improvements, energy consumption in buildings would be 12% higher than current levels (IEA 2018, pdf). However, there is still a large potential for further efficiency savings which have not been realised. Therefore, to ‘improve’ consumption, we considered the impact of widespread adoption of the best available technologies in new appliances, and the potential for future technological advancements.
Key assumptions include:
- Gas hobs and ovens are phased out by 2035, replaced with electrical appliances. 10% efficiency saving are available in electric hobs and ovens, which are achieved by 2030 (IEA, 2012).
- In lighting, incandescent sales are phased out by 2025, and are out of use by 2027. Fluorescent sales are phased out by 2030, and are out of use by 2035. We also assume that there are 5% efficiency improvements still available in light emitting diode technology, which are achieved by 2025 (Paoli and Cullen, 2020).
- Best available technologies are adopted across other appliances, resulting in efficiency savings of 45-60% in cold and wet appliances, 65% in consumer electronics, and 50% in air conditioning units (Grubler et al., 2018; IEA, 2018).
Additional assumptions specific to the Transform demand scenario include:
- The widespread adoption of smart meters with disaggregated and normative electricity consumption feedback reduces household electricity consumption by 5%, excluding cold appliances.
- A 5% reduction is achieved in air-conditioning units from improved cleaning of coils (McKinsey Global Institute 2011, pdf).
- A 20% reduction in energy use from ICT and other appliances through replacing manual with automated building management controls (Grubler et al., 2018).
- The total number of appliances per household is reduced by 20% in lighting and 10% in ICT and consumer electronics due to demand saturation, cloud computing and increased sharing.
 3.3.6 Materials & products
This energy service category refers to strategies that aim to reduce the energy demand embodied in the production of materials and products by UK industry. We focus on the material input and demand for clothing and textiles, packaging, vehicles, electronics, appliances and machinery, furniture and buildings and infrastructure. In 2019, emissions attributed to UK industry total 102 MtCO2e, representing 22% of UK GHG emissions (CCC 2020a). GHG emissions from UK industry have declined significantly, falling by 53% when compared with levels in 1990 (CCC, 2020a).
Some of these savings can be attributed to reductions in industrial energy use resulting from energy efficiency savings, however, most of these reductions are explained by the offshoring of the production of goods previously made in the UK (Hardt et al., 2018). The energy demand reductions in this scenario look to reduce industrial energy use embodied in the production of materials and goods without offshoring this to other countries. The analysis focuses on UK action. Due to the international trade of materials and products additional reductions would be seen if similar strategies were followed by overseas consumers of UK manufactured materials and products.
We consider three key options for reducing the energy demanded in the production of materials and goods: resource efficiency, energy efficiency, and changes to construction’s demand for materials. Resource efficiency strategies reduce the required output of materials and products. Energy efficiency strategies reduce the energy demand to produce each unit of output. Additionally, changes in construction demand are an important driver of material production and associated energy demand.
Resource efficiency options were based on an existing review of opportunities for the UK (Scott et al 2019). This is the widest existing assessment of such options for the UK and has been used extensively by (amongst others) the Climate Change Committee in informing the potential for resource efficiency within their carbon budget analysis (CCC, 2020b) and the UK Government’s recent Industrial Decarbonisation Strategy (BEIS 2021b). The resource efficiency opportunities related to construction and nutrition from the earlier analysis of Scott et al. (2019) were not included in the current assessment as each is analysed independently here.
Energy efficiency measures in the LED scenarios are based on the existing technology options within the UKTM model (see Appendix), which are based upon a review of technological options at the level of industrial subsectors in the UK Energy Research Centre Usable Energy Database (Griffin et al 2013, pdf). The sectors represented in UKTM, covered by this analysis are iron and steel, non-ferrous metals, cement, non-metallic minerals, chemicals (ammonia), chemicals (high value chemicals), chemicals (other), paper and others. UKTM was used to select efficiency measures for each sector in a cost optimal manner to reach the emissions targets of each scenario.
The construction sector is the largest user of materials and the largest producer of waste by tonnage in the UK (CLC and GCB 2020, pdf). The sector is the principal consumer of a sizeable proportion of industrial output, particularly of key highly energy intensive materials, such as cement and steel. There is potential to reduce demand for production of these materials (and the corresponding energy demand) by changing national demand for new buildings and infrastructure; and how these assets are designed and delivered. In this analysis we derive future estimates of demand for key construction materials based upon scenarios of future demand for buildings and infrastructure; and the uptake of a range of mitigation measures that may reduce the quantity of new materials needed to service this demand.
Whilst many of the measures undertaken to reduce demand in the construction sector fall into the categories of resource and energy efficiency, they were treated separately given the significant contribution of construction to total energy demand, and construction’s interrelationships with other sectors. To do so, a literature review of over 60 academic publications and industrial case studies was undertaken to identify mitigation options, which were then analysed using a construction-specific dedicated model. The bespoke model considers 36 specific applications of key materials across 17 different built asset categories.
Key assumptions include (see sector summary for further details):
Energy efficiency
- Improvements to current processes and replacement technologies (including fuel switching) are selected at the UKTM subsector level, to meet emissions targets in a cost optimal manner.
Resource efficiency
- In the reference case industrial output was taken from UKTM (which is aligned with the BEIS Industrial Pathways Model, 2017).
- Forty four resource efficiency strategies were applied across clothing and textiles, packaging, vehicles, electronics, appliances and machinery and furniture.
- The Transform demand scenario sees the adoption of maximum technical potential of these strategies in 2032, the Shift demand scenario represents a 66% adoption over the same time period. This aligns with the medium and high scenarios of Scott et al. (2019).
- The full supply chain impacts of these strategies, applied within the UK, on the industrial subsectors of UKTM was determined using a multi-regional input-output modelling approach. A logistic model was used to extrapolate these impacts to other time periods.
Construction
- Baseline future demand for new infrastructure construction to 2050 was taken from projections within the Green Construction Board’s Low Carbon Route map for the Built Environment.
- Demand for new construction under the Shift and Transform demand scenarios was primarily determined by assumptions developed within the analyses of other energy service sectors (e.g. under the Transform demand scenario for Transport it is assumed that no new road building takes place, therefore output for the asset sub-category of ‘Roads’ is set to zero in the corresponding construction sector model scenario).
- 21 additional mitigation options to reduce material demand from construction were adopted across specific applications and asset categories based on the maximum practically achievable deployment in 2050, with a linear trajectory to this year.
3.3.7 Mapping dependencies between sectors
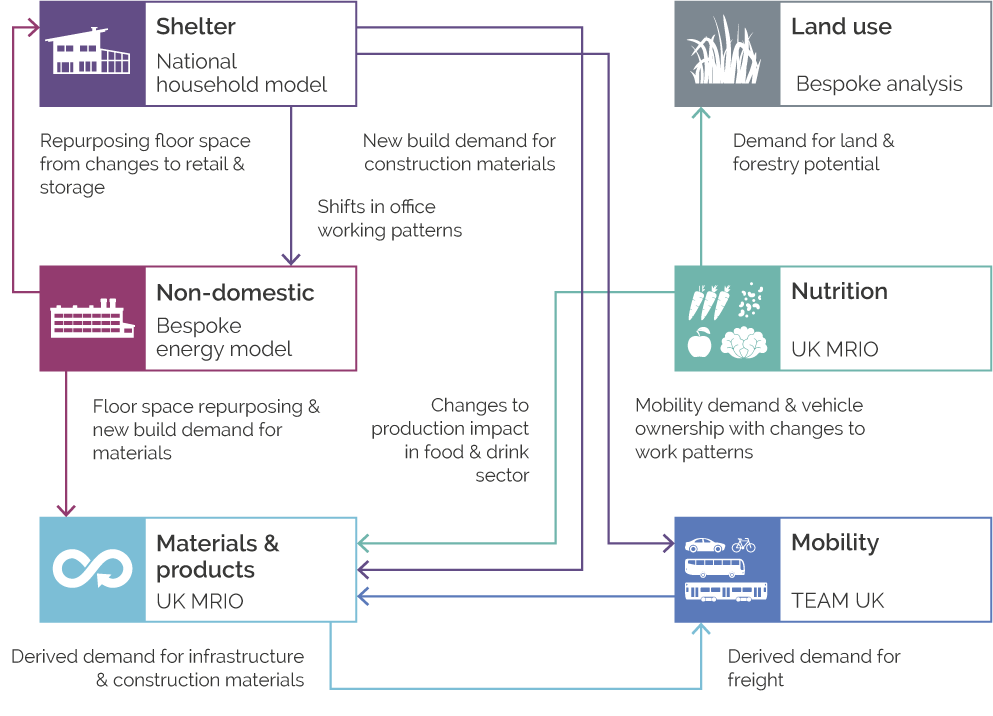
A critical part of the sectoral modelling process was to map the dependencies between sectors, to ensure consistency so that key aspects of the narrative represented in one sector were also reflected in others. Figure 5 shows the main dependencies between sectors. Many flow from the shelter analysis (shown by the blue arrows), where shifts in working patterns fundamentally change type and patterns of mobility demand, and the use of non-domestic buildings. Differences in house build assumptions are also reflected in the demands for construction materials. Choices about transport infrastructure also impact on the demand for construction materials, while changes in vehicle sales impact on manufacturing. Changes to diet also impact the level of land take, which feeds into land availability for forestry. It also changes the level of output in specific food and drink subsectors, impacting energy demand in that sector.
3.4 Modelling whole system net-zero scenarios
The final step of the analysis was to integrate the sector analyses into an integrating framework, primarily to explore the system wide implications of lower energy demand requirements on energy supply, and the role of CDR. For this we use UKTM, a technology-explicit, whole system, partial equilibrium model. The model, which uses the TIMES modelling framework (Loulou et al 2016, pdf), optimises future energy system evolution using linear programming, and future investment choices to meet energy service demands at least-cost (based on minimising the discounted net present value for the whole system). The model has been used across a wide range of energy scenario studies (Fais et al 2016; Pye et al 2017; Fuso Nerini et al 2017; Zeyringer et al 2018; Broad et al., 2020). In recent years, it has been co-developed with the UK’s energy ministry (BEIS), who have used it extensively to inform their energy strategies (DECC 2016, pdf; HM Government 2017, pdf).
The model represents the existing energy system in 2010, including the existing infrastructure assets (power generation plants, vehicle stock etc.) across sectors, and flows of energy. This is graphically represented using a systems network diagram, or Reference Energy System. In UKTM, the whole system is represented, from resource extraction, through to primary and secondary fuel production (electricity, hydrogen, biofuels), and finally consumption in the residential, industrial, service, transport and agricultural sectors. This final energy consumption is used to meet the wide range of energy service demands needed across the economy, such as mobility, heating, and industrial production.
For scenario exercises, projected energy service demands are exogenous inputs into the model. The model then solves by exploring least cost supply-side solutions to meet those future service demands (‘Supply-side’ refers to any part of the system used to supply energy to meet energy service demands. This includes transformation / conversion processes e.g. electricity generation, and all of the technologies used in end use sectors e.g. gas boilers, cars, cement kilns etc. It also includes some explicit energy saving measures in the buildings sector, such as fabric retrofit). The whole system representation allows for the trade-offs between sectors in respect of resource allocation. Demands for energy vectors, such as electricity and hydrogen, are endogenous to the model, and sensitive to changing prices driven by the dynamics of balancing demand and supply. The other benefit of the whole system representation is that it allows for comprehensive accounting of energy-related GHGs, plus other key non-energy sources, such as agriculture and land use. This means the model can be used for exploring energy systems that meet climate and energy policy goals.
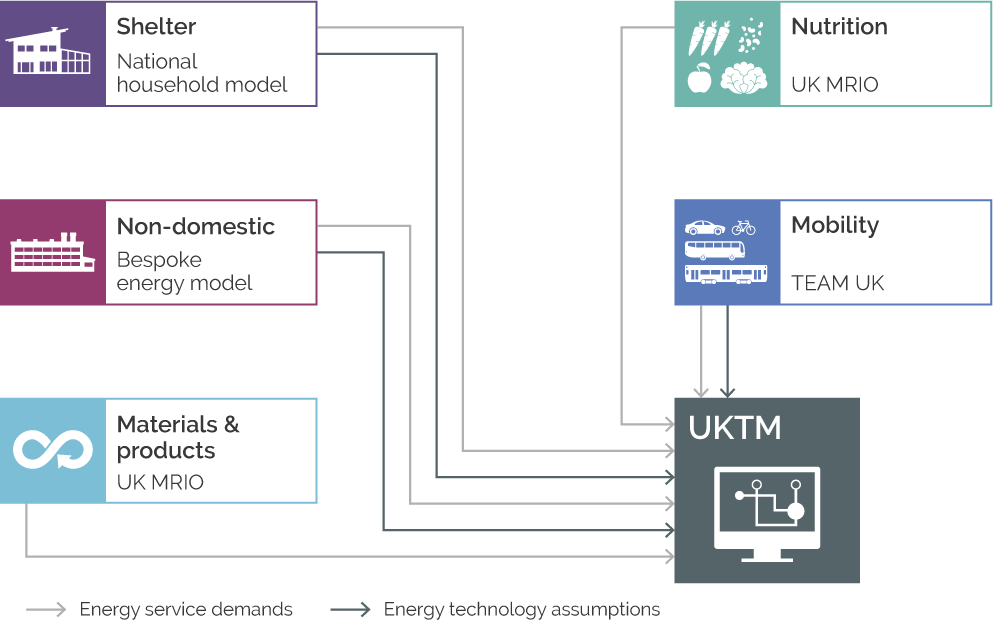
This section describes the linkages between the sector modelling and the whole system modelling using UKTM. These are illustrated in Figure 6 below. The sector analyses, based on the agreed scenario narratives, were undertaken using a variety of modelling approaches (see Table 2). Under each scenario, the sectoral modelling provided estimates of energy reduction through ‘improve, shift, and avoid’ measures. Two types of information relevant to energy demand were passed to UKTM for integration:
- Energy service demand projections (grey arrows in Figure 6). These inform how energy services will change over time, based on ‘avoid’ measures and some ‘shift’ measures in transport, and are exogenous inputs to UKTM. Based on the projected energy service demands, UKTM is used to construct an energy supply system to meet those demands (as described earlier).
- Technology efficiency measures (dark grey arrows in Figure 6). The sectoral analyses also took account of opportunities for ‘improving’ the efficiency of energy use, and shifting to cleaner energy use. Such measures include improved efficiency of technologies, switching to electricity using appliances, and building retrofits. Such measures are considered endogenously by UKTM; therefore, we have not hardwired associated final energy demand reductions in to UKTM from the sectoral modelling. Rather we have tried to align input assumptions on technology efficiency, and deployment rates, followed by an iterative process of checking model outputs with sector teams (The approach to endogenise sectoral assumptions in UKTM means that there are some differences between the sectoral and UKTM outputs. Differences have been tolerated where these are not significant, particularly as the key insights from UKTM relate to implications for energy supply to end use sectors.)
The linkages between sector models and UKTM are described in turn below. Further information on specific UKTM assumptions across sectors can be found in the Appendix.
Mobility: The sectoral modelling approach for mobility includes the development of energy service demands based on in depth assessment of a range of behavioural levers, which are then fed into the UK Transport Energy and Air Pollution Model (TEAM) (Brand et al., 2019) to explore vehicle choices and rates of deployment. Aviation was restricted to an assessment of energy service demands influenced mainly by socio-economic, demographic and policy (e.g. changes in the cost of air travel via pricing such as frequent flier levy) drivers.
UKTM received energy service demand projections for all transport subsectors, except shipping, which was considered separately by the UKTM team. On energy technology assumptions, the key alignment was on vehicle efficiency factors to those in TEAM. The modelling teams also iterated on UKTM constraints, including rates of technology deployment.
Shelter: This analysis uses the UK’s National Household Model (NHM), focusing on heating requirements under different scenarios, which factor in varying levels of new house building, retrofitting, and other behavioural changes.
For this sector, UKTM received the energy service demands for space and water heating. Given that these energy service demands already include heat demand savings from energy efficiency measures, building retrofit options were switched off in UKTM to avoid double counting. In respect of energy technology assumptions, the assumptions are already aligned to the NHM; further alignment on heat pump deployment was undertaken to differentiate between scenarios.
Non-domestic: The sectoral modelling for non-domestic buildings was built around the UK Building Energy Efficiency Survey (BEES) dataset (BEIS, 2016a) and used to explore different rates of energy efficiency uptake across the modelled scenarios. By reviewing the current and future expected building stock for each of the main sub-sectors, including main commercial, leisure, and public service building uses, this approach estimates the full technical savings potential across the sector and translates different levels of ambition into varying growth rates for corresponding energy efficiency options.
The results from this model provided direct input into UKTM by informing the total energy efficiency gains from building retrofit and management measures that are not related to technology replacement. These include fabric, building instrumentation and control, and carbon and energy management systems. Their roll out was then limited in UKTM according to the levels of ambition relevant to each scenario. Efficiency gains from technology switching (primarily through electrification) are estimated endogenously in UKTM.
In parallel, different growth trajectories for future building stock number – proxied through total floorspace requirements – were developed for each scenario. These were built specifically for this sector but were developed in consultation with experts across the project to mirror changing pressures on, for example, storage space requirements in line with changes in retail shopping and home delivery. These floorspace requirements then provided the main energy driver input into UKTM as their change over time was used to inform future growth in energy service demand in the model.
Materials & products: The input to the industry sector of UKTM was from the sector analysis of resource efficiency gains as estimated in UK MRIO. The approach was to first apply resource efficiency percentage gains to the UKTM growth drivers; these growth drivers are largely taken from the UK Government econometric energy demand model, EDM (BEIS 2019b, pdf). In addition, further adjustment factors to account for changes in infrastructure construction in other sectors e.g. buildings, transport were applied to key sectors producing construction materials e.g. iron and steel, cement.
Nutrition: The integration into UKTM of the sector analysis of nutrition covers the resulting on-farm agricultural changes, in terms of emissions and land availability, due to changes in the overall national diet as well as scenarios for the reduction of food waste throughout the supply chain. To achieve this, the emissions of methane and nitrous oxide relating to crops and livestock in UKTM were updated to follow the trends in the sectoral modelling for each scenario. The resulting land freed up by a shift to a more plant-based diet was used to define new limiting constraints on the planting of forests within UKTM (both for biodiversity and energy crops) such that the more ambitious the nutrition scenario, the more land that becomes available for forests out to 2050. Finally, the assessment of food waste generation from the sector analysis for each scenario were used to adjust the trends shaping the scale of food waste production in UKTM.
In addition to the LED scenarios, two additional scenarios were considered at the system level in the UKTM analysis for comparative purposes. These include a scenario called Ignore demand, based on achieving reductions as estimated in CCC 2018 progress report, including medium risk policies (CCC 2018b). The second scenario is called Steer demand, which aims for net-zero GHG emissions by 2050, based on all legislated carbon budgets including Carbon Budget Six. However, the scenario fails to achieve the 2050 target, falling short by 27 MtCO2 despite high levels of removals. It relies on improved energy efficiency and supply-side options only, with no consideration of measures for avoiding energy use or shifting to options that supply energy services with less energy e.g. private cars to public transport. Energy service demands used for this scenario reflect those used in UKTM analysis, and sourced from UK Government analyses. All scenarios modelled in UKTM are described in Table 2.
| Scenario | Demand narrative description | Climate ambition* |
|---|---|---|
| Ignore demand | Identifies levels of energy demand up to 2050 based on UK Government climate policy instruments as of 2018, as described in the CCC 2018 progress report. | Based on achieving reductions as estimated in CCC 2018 progress report, including medium risk policies. This is a 12% reduction in 2032 relative to 2020 (or 50% relative to 1990). This leads to GHG emissions of 390Mt by 2050, from 2020 emissions of 470 MtCO2e. |
| Steer demand | This is considerably more ambitious than the Ignore demand scenario. Maintains energy service demands (as per the Ignore scenario) but has the goal of reducing emissions to net-zero by 2050. | Net-zero GHG target in 2050 pursued (27 MtCO2 deficit), plus Carbon Budget 1–6. |
| Shift demand | Significant shift in the attention given to energy demand strategies providing an ambitious programme of interventions across the whole economy describing what could possibly be achieved with existing technologies and current social and political framings. | Net-zero GHG target in 2050, plus Carbon Budget 1-6; cumulative emissions equivalent to 4.95 GtCO2. |
| Transform demand | Considers transformative change in technologies, social practices, infrastructure and institutions to deliver both reductions in energy but also numerous co-benefits such as health, improved local environments, improved work practices, reduced investment needs, and lower cumulative GHG emissions. | Net-zero GHG target in 2050, plus Carbon Budget 1–6; cumulative emissions equivalent to 4.95 GtCO2. |
| * All scenarios except Ignore demand have also been run with the cumulative carbon budget of 3.87 GtCO2, described below. | ||
3.4.1 Carbon budget modelling assumptions
In addition to those scenarios listed, the Steer demand and two LED cases, Shift and Transform, were also run with a cumulative carbon budget consistent with the targeted temperature rise and responsibility sharing justice principles of the Paris Agreement. Determining a single national carbon budget that can be defined as the UK’s obligation to the Paris Agreement is not possible. When dividing a global carbon budget between countries there are a number of assumptions that could be taken based on historical contribution to GHG emissions, capacity to change, per capita allocations and other equitable considerations. Added to this, deriving Paris Agreement compliant national carbon budgets comes with significant scientific uncertainty ranges.
This enables a wide range of UK carbon budgets to be considered ‘aligned’ with the Paris Agreement. We have estimated that the UK carbon budgets and net-zero target results in cumulative emissions of 4.95 GtCO2 for the period 2020–2050. This cumulative estimate, derived from the UK targets, can be considered to be the overall carbon budget to 2050.
Given the uncertainty in what constitutes a Paris Agreement-aligned target, we have also considered an alternative budget. The value of this is to ascertain whether the two LED scenarios offer the opportunity to increase the climate ambition of the UK.
The additional carbon budget chosen in this study was derived using a resource sharing approach as developed by Anderson et al (2020). It allocates larger shares in remaining carbon emissions to ‘developing’ countries to facilitate necessary economic development, before apportioning the remaining budget to developed nations using a grandfathering method. The UK’s budget, derived by this method is 3.87 GtCO2 (For a detailed description of the method used to derive this UK remaining carbon budget see Anderson et al. (2020). The budget here differs slightly to the one presented by Anderson et al. (2020), as the UK’s share of global cement process emissions are included). Our additional carbon budget is 22% lower than the budget derived from the UK’s current planned budgets. This budget is an ambitious carbon budget for the UK. It was chosen based on its robust internalisation of the principle of common but differentiated responsibility and respective capacity at the heart of the Paris Agreement. This assigns the UK, and other wealthy early-industrialised nations emissions sooner and faster than those who have contributed less to the climate crisis. In the modelled scenarios, this CO2 budget was implemented from 2020–2050, with net-zero GHG emissions also having to be met by 2050.