4 Results & discussion
Reading time: 16 minutes
This section provides an overview of some of the key insights building on our four scenarios, based on eight key findings from our analysis.
4.1 Securing net-zero GHG emissions will require ambitious energy demand reductions
The Ignore demand scenario describes the effect of existing policies as established by the UK Government in 2018, rather than their stated future ambition of recent months. As a result GHG emissions of 390Mt remain in 2050 demonstrating that there is a clear policy implementation gap to get anywhere near the net-zero target. Comparatively, the Steer demand scenario is constrained to reach net-zero by 2050 while maintaining current energy service demands and accounting for limits to sustainable biomass availability and reasonable bounds on the use of Direct Air Capture (DAC). It does include considerable energy efficiency improvements along with substantial decarbonisation of supply and a range of CDR technologies. Notwithstanding, the Steer demand scenario does not meet the UK net-zero GHG target in 2050 and results in an emissions gap of 27 MtCO2e, as shown by the pink bar in Figure 7. This is largely due to residual emissions in agriculture (24 MtCO2e) and international aviation (37 MtCO2e) that exceed our assumed capacity for CO2 removals. While alternative assumptions could arguably allow for higher levels of removals, incremental reliance on these options comes with additional risk that scenarios presented here seek to mitigate.
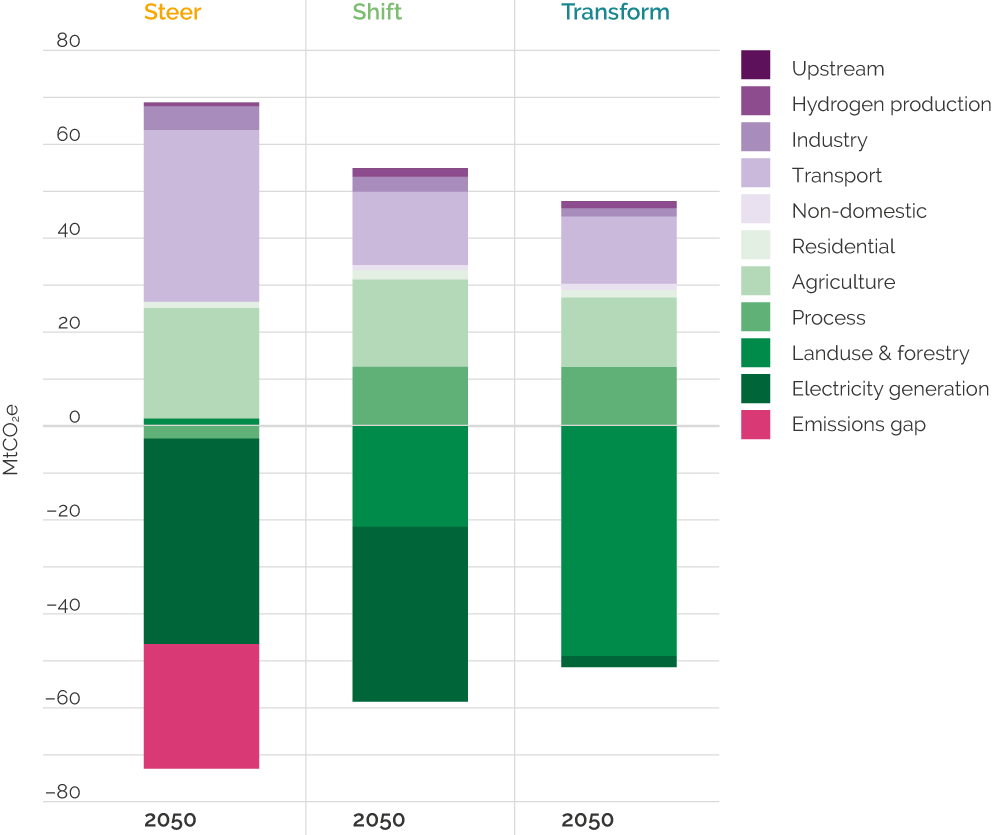
Dealing with these residual emissions can be achieved through reductions in energy demand that go beyond energy efficiency and offer a more robust approach, by reducing reliance on CDR, whilst ensuring that the net-zero target can be achieved. These deeper reductions in energy service demands are applied here across all sectors of the economy and are shown to reduce the energy and carbon pressures on the overall system, meeting climate targets with less reliance on higher risk technologies. This is highlighted in both LED cases, where neither have an emissions gap. The Shift demand scenario reduces GHG emissions to 55Mt while the Transform demand scenario reduces GHG emissions to 47Mt by 2050. This compares to the Steer demand scenario with GHG emissions of 69 Mt in 2050 which can’t be offset. The Ignore demand scenario, by stark contrast, would lower emissions by just 50% compared to 1990.
4.2 The UK can halve energy demand relative to current levels.
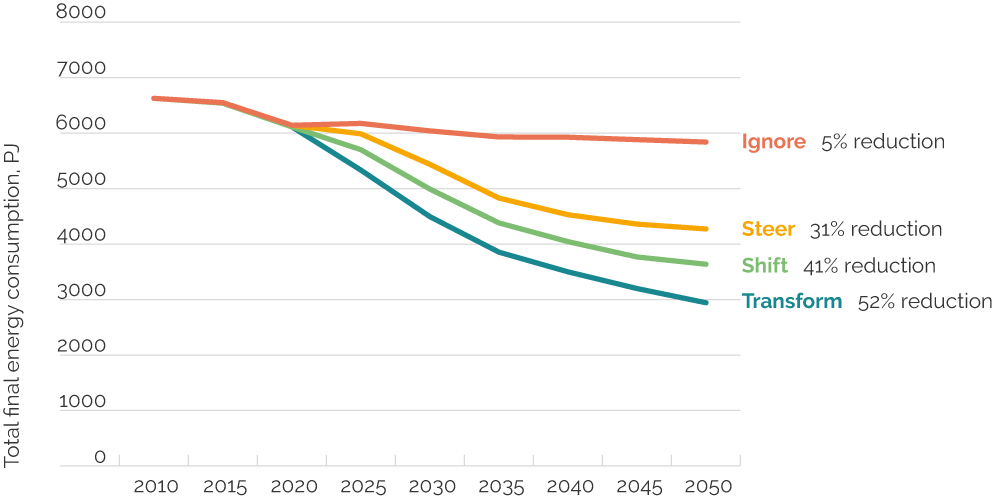
The Ignore demand scenario shows that the UK Government’s existing policies fail to reduce energy demand by any notable level. Energy demand in this scenario reduces by 5% between 2020 and 2050. The Steer demand scenario maintains energy service demands but implements a wide range of energy efficiency measures. This scenario shows a 31% reduction in final energy demand between 2020 and 2050. It is important to remember, however, that this scenario fails to reach the net-zero target.
The two LED scenarios show that the potential for energy demand reductions, necessary to help meet net-zero GHG targets, is extremely high. Under the two low energy demand cases, reductions in energy service demands combined with strong and sustained energy efficiency action can reduce final energy consumption by 41–52% in 2050, relative to 2020 levels (Figure 8).
Crucially, the changes in energy consumption that occur over the next 30 years in the LED cases do not see corresponding drops in the activities that the use of energy supports: low energy demand does not come at the expense of activities that support a good quality of life, such as mobility services, warm homes, strong industrial production, or healthy diets.
Under the Ignore demand case, established UK policies help to achieve a 50% GHG reduction in 2050 (relative to 1990) with energy consumption levels remaining similar to those seen today. This highlights that under lower levels of ambition, mitigation can occur largely through fuel decarbonisation, a notable feature of the gains made in the UK to date. This is not the case if we are to reach net-zero GHG targets, we need both strong supply and demand side action in order to achieve the pace of change required.
4.3 Energy demand reduction is possible and required across all sectors
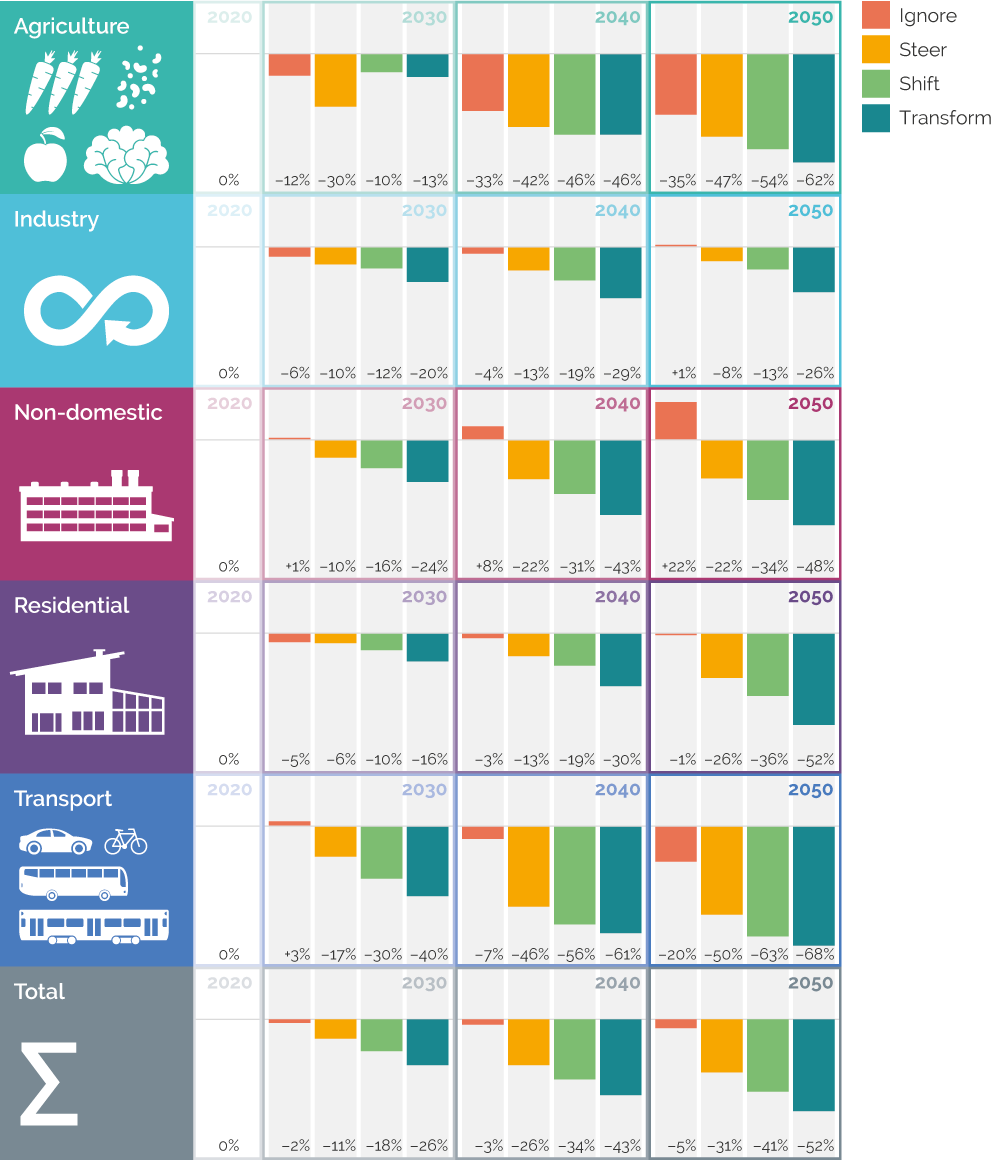
The breakdown of energy demand reductions by sector is shown in Figure 9. By design, this reduction will necessarily reach across all sectors of the economy, but interestingly this reach is unequal. Under the most ambitious low energy demand case, Transform, all sectors except industry have reductions exceeding 50% (relative to 2020). The transport sector compensates for the lower reduction in industry, allowing the economy as a whole to more than halve energy consumption by 2050. The relative difference in building sector energy consumption between the reference and the low-demand cases in 2050 highlight the comparatively deeper efforts required to support net-zero in this sector. While the agriculture sector has the highest relative reductions, this is also a very low energy consuming sector when compared to other parts of the economy.
The smaller relative reductions seen in industry can be explained by several effects. Firstly, this analysis focused on UK actions to reduce energy demand. The industrial sector supplies materials and products to consumers within the UK, and also overseas. Therefore, additional reductions may be seen if overseas consumers were to follow similar resource efficiency strategies as UK consumers did in our scenarios. Secondly, carbon capture and storage (CCS) is utilised in some industrial subsectors to reach challenging decarbonisation targets. This causes an increase in energy demand. Finally, energy-intensive subsectors of industry are starting from an efficient baseline (as energy forms a significant part of their operating costs these subsectors have been historically driven to reduce their energy demand), and therefore further demand reduction is more challenging than in other sectors.
4.4 Reaching net-zero requires both energy efficiency and societal change
Energy efficiency improvements from heat pumps, electric vehicles and home retrofit, for example, are not the only options to reduce energy demand. In fact, our scenario analysis shows that by implementing energy efficiency alone without considering broader shifts in consumption patterns and reduction in energy service demands, net-zero is very difficult to achieve.
Figures 10a and 10b show the proportion of the reduction in energy demand associated with either efficiency improvements or broader societal changes in patterns of consumption. This analysis follows a similar framework first developed in Germany in the early 1990s (Transformative Urban Mobility Initiative, 2019) and later adopted by Creutzig et al (2018), namely the “Avoid, Shift, Improve” framework. Dividing our reductions by these three categories proved difficult due to the nature of the modelling exercise (bottom up approach) and the fact that there is considerable crossover between the categories. Therefore, for each of the two LED scenarios we consider Improve to be “efficiency” that maintains energy service demands and “Avoid / Shift” that represents a reduction in energy service demand. Here we compare the difference in 2050 between scenario 1 (Ignore demand) and scenario 3 and 4 (Shift and Transform demand).
There is a reasonable variation across the different sectors as to whether the reduction is derived from an efficiency improvement or a shift or reduction in energy service demand. In our Shift demand scenario, the majority of the reduction relates to efficiency (86% for non-domestic buildings and 57% for domestic buildings). In contrast, the majority of the reductions in nutrition and materials and products derive from broader societal changes in shifting consumption patterns and reducing the need for energy services.
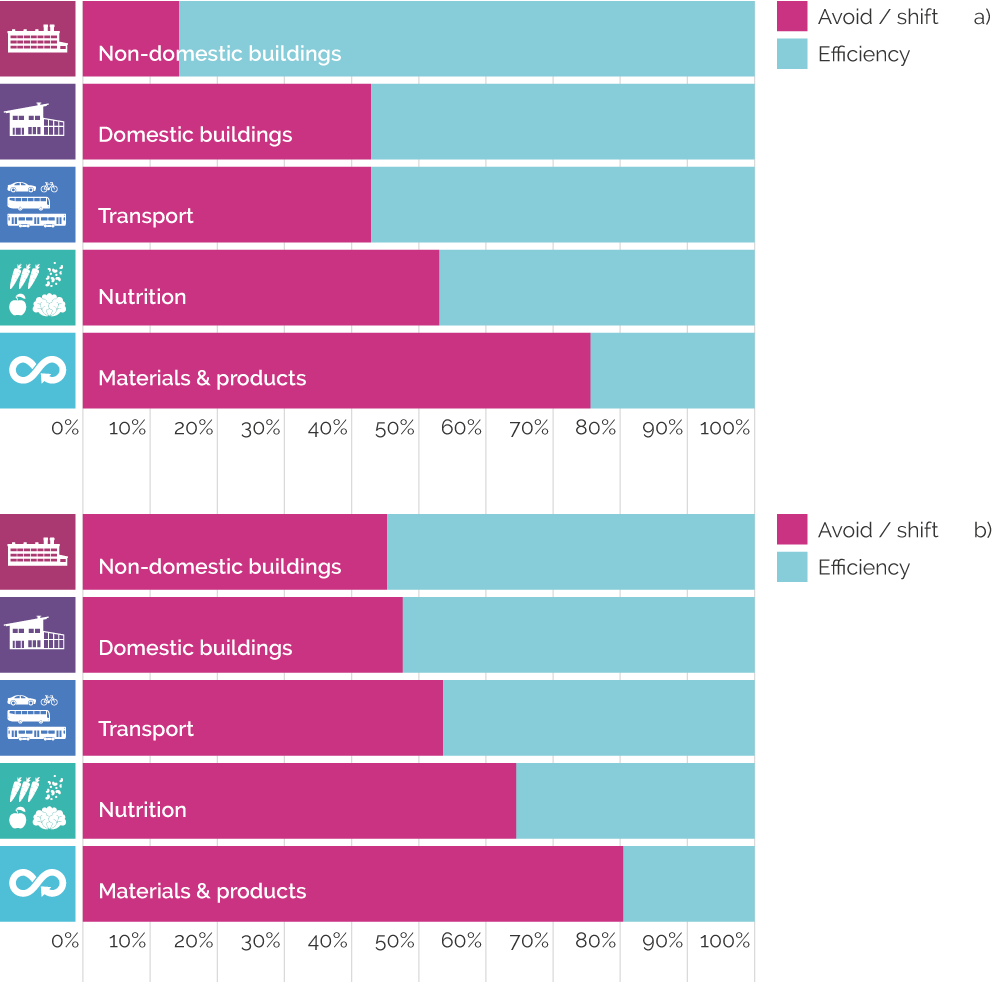
The Transform demand scenario shows a greater percentage of reductions in energy demand coming from broader societal changes. There is significant change in the non-domestic building sector, where efficiency now represents 55% of the reduction compared to 86% in the Shift demand scenario. The change in domestic buildings is very small between the two scenarios. Transport changes from efficiency representing 57% of the reductions down to 46%. The changes are relatively small in nutrition, and materials and products that already had a strong reliance of broader societal changes.
4.5 A smaller energy system moderates the technical challenges of building out low carbon infrastructure
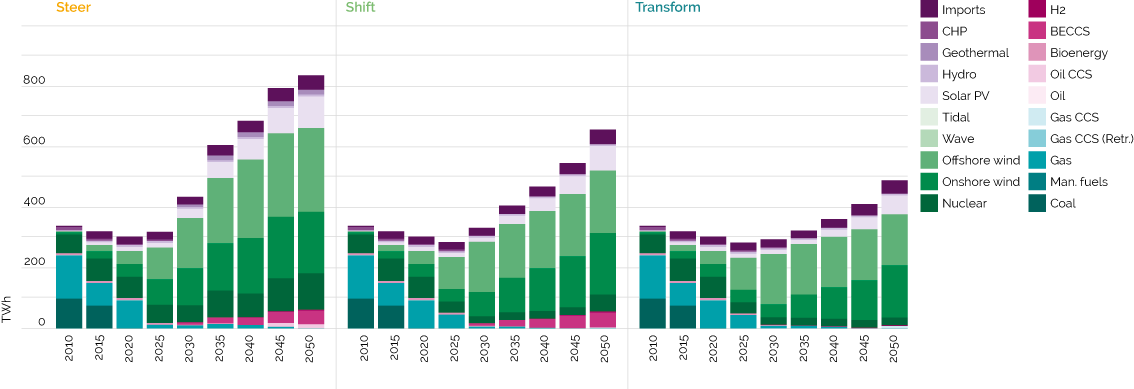
A net-zero target means that the energy system has to be transformed to fully decarbonise the UK economy. This includes retrofitting homes to make them more energy efficient, replacing all vehicles with low carbon technology, investing in new industrial processes, and replacing fossil-based energy supply infrastructure. The challenge is enormous. It relies strongly on high levels of societal acceptance of new technologies, and presumes that the very real technical hurdles of building out a new infrastructure in a relatively short period of time are overcome. A smaller energy system, resulting from reductions in energy demand, can help to moderate this challenge. A key part of the future system is the power generation sector, which needs to be both decarbonised and then scaled to meet the growing demand for electricity as a key low carbon energy vector. In the Steer demand scenario, we estimate that generation in 2050 will exceed 800 TWh, representing a 150% increase on current generation levels (Figure 11).
While the importance of electricity as a critical decarbonisation lever does not go away in the low energy demand cases, the reductions do lead to a much smaller system than in Steer demand. While Shift demand and Transform demand do see increases of 94% and 44% on current generation levels in 2050, these remain respectively 21% and 42% lower than levels required under the Steer demand case. When considering implications for specific technologies, this means that significant capacity expansion in difficult-to-build nuclear power and highly uncertain bioenergy with carbon capture and storage (BECCS) for power technologies are either reduced, or not required as demand reduction ambitions increase. Differences in system capacity are shown in Figure A4 (Appendix).
More broadly, the energy infrastructure required across the system also shrinks. In the Appendix, Figure A5 shows the reduction in mobility demand across different road transport modes. These can be directly translated into vehicle fleet numbers, as we make a simplifying assumption that all vehicles deliver the same level of mobility service in a given year. A 13% increase in cars by 2050 in Steer demand compares to a 70% reduction in the Transform demand case, and a halving of the car fleet in Shift demand. Reductions, albeit not at the same level as for cars, are seen across other vehicles types; of course, this is, to some extent, offset by increases in public transport provision, with bus numbers increasing.
4.6 Lowering energy demand reduces reliance on high-risk engineered removals
There are a wide range of options that will be needed for the UK to get to net-zero emissions. While all have different associated risks, these are particularly significant for those decarbonisation strategies that rely heavily on the scale up of CCS and CDR (Anderson and Peters 2016). The inherent risks of these technologies failing to scale in future years mean that they lack robustness, while the confidence they project in reaching stringent emission reduction goals in the longer term reduces the sense of urgency for the required mitigation action to take place today (Pye et al 2021). Strong demand-side action can reduce the requirements for energy use across the economy, lowering associated emissions and thereby reducing the reliance on such engineering solutions. Removals through BECCS and direct air capture (DAC), shown by the green and purple bars in Figure 12a, total 49 MtCO2 in 2050 for the Steer demand scenario, which increases to 76 MtCO2 if we infer that the emissions gap to net-zero also requires removals. This level can be more than halved to 37 MtCO2 in Shift demand, or removed completely under Transform demand, where no engineered removals are required.
Fossil CCS, shown by the purple bars in Figure 12, is deployed across all scenarios; in the lower demand scenarios this is primarily for industry and hydrogen production via steam methane reforming. However, this could conceivably be reduced to much lower levels by a stronger focus on electrolysis for hydrogen production (The UKTM model underestimates the potential role of hydrogen production from electrolysis as it is unable to effectively represent the low cost electricity from renewables that is surplus to demand and which could be used for hydrogen production).
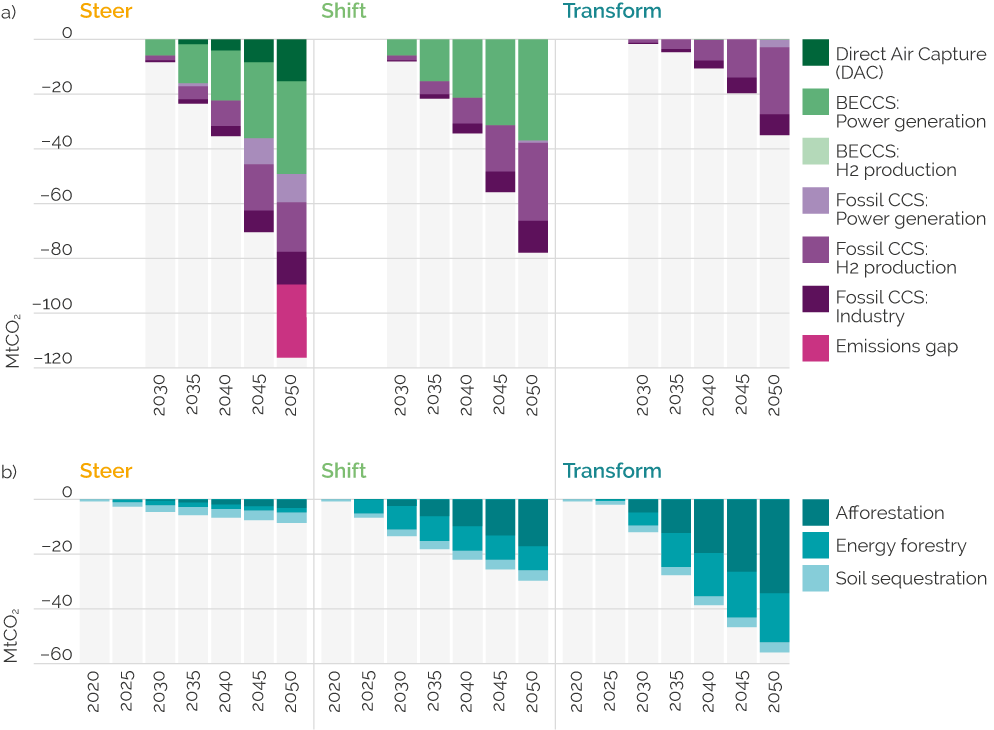
The low energy demand cases focus more on nature-based removals, with ambitious rates of tree planting, enabling removals of close to 60 MtCO2 by 2050 in Transform demand. In this scenario, the increase in tree planting reflects a strategy to meet other broader environmental goals around biodiversity and land management. This is partly enabled by the reduction in livestock farming linked to changes in diet. The fast roll out of such planting programmes has arguably been challenging in recent years, so it is worth noting that the Transform demand scenario, because of the lower pressure across the system, still has the flexibility to avoid engineered removals and meet the net-zero GHG target with just 27 MtCO2e from forest-based sequestration – that is, at less than half the total displayed below.
The cumulative level of sequestration across all of the options is shown in Figure A2 (Appendix). Cumulative engineered removals total 780 MtCO2 (including 130 MtCO2 from the emissions gap, implied gap over a 5 year period.) in Steer demand, compared to 550 MtCO2 in Shift demand and zero in Transform demand.
In summary, a key feature of the LED scenarios are the earlier efforts they display to reduce energy consumption, instead of waiting to scale engineered removals in future years. Energy demand reduction measures can be implemented immediately. When considering the UK’s impact on the changing climate, meeting targets in 2050 can be achieved with different cumulative emissions along the way. The lower the cumulative CO2 emissions, the lower the risk of increasing our contribution to rising temperatures.
This again underlines the importance of a strong focus on reducing energy consumption alongside decarbonising energy supply today, in order to de-risk the net-zero strategy. It is evident that some CCS and removals will be required, even in the most ambitious low energy demand case, but at much lower levels and with a focus on nature-based removals with their associated co-benefits.
4.7 A smaller system means lower investment and running costs
The transition to a net-zero economy means very high levels of investment to build out new energy supply infrastructure and invest in end-use, demand side technologies e.g. cars, boilers. As already highlighted, LED cases can significantly reduce both investment levels and the cost of operating the energy system. Normalising results to 2020, Figure 13 shows how much less these costs increase over time for the LED cases compared to Steer demand. Costs in 2050 are comparable to those seen today under Transform demand and only increase by 30% under Shift demand; this compares to an increase of almost 70% under Steer demand. Figure 13b shows how Shift and Transform demand cases have an annual expenditure more than 20% and 40% lower, respectively, than Steer in 2050, offering increasing levels of savings in system operation as the pathways unfold. These percentages translate to an annual reduction in cost of around £95 and £170 billion/year in 2050 from the £410 billion required for the Steer demand case.
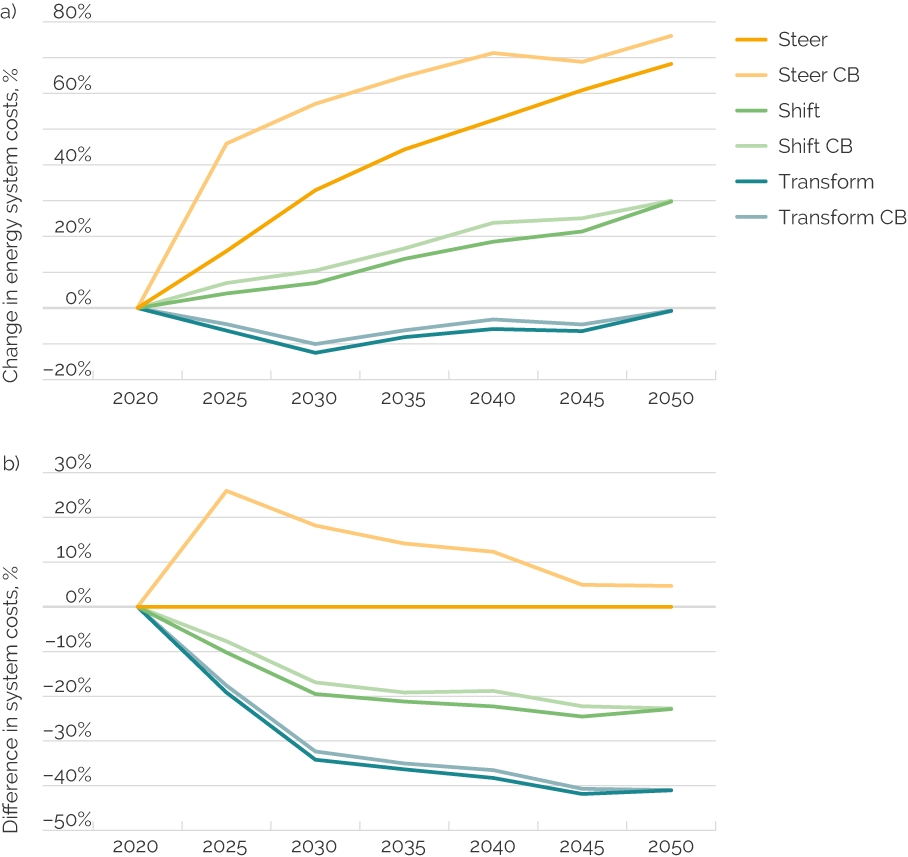
The ‘CB’ cases represent higher mitigation ambition variants (as described in the section below). Interestingly, the relative additional costs of increasing ambition appear much lower for the LED cases compared to that for Steer demand. They also occur on a different timescale with the Steer demand case seeing higher relative investment requirements very early on. Comparatively, the LED cases measured increases in budget needs spread more evenly between now and 2050. This, in part, reflects the increased optionality the LED cases have due to lower energy demand and smaller energy systems.
Investments not spent on energy system infrastructure and technologies can be re-directed elsewhere, including on the policy packages required to realise the energy demand reductions mapped out in these scenarios. Further information on sectoral investment in the power generation and transport sectors is provided in Figures A6 and A7 in the Appendix.
4.8 Lowering energy demand makes increased climate ambition possible
The UK has consistently tightened its climate targets over the last 15 years. While the adoption of a net-zero target in 2020 continued this trend, there have been calls for even stronger ambition, to reflect what might be considered a more equitable allocation of global efforts to reduce emissions. In a recent paper, Anderson et al. (2020) account for markedly increased rates of mitigation required in futures where the “common but differentiated responsibilities and respective capabilities” approach is applied in a quantified framework looking at energy related emissions that remain possible while remaining, globally, well below 2ºC of global warming.
Taking the UK as an exemplar country for their approach, their proposed cumulative budget of 3.7 GtCO2 between 2020 and 2050 has been implemented as a Carbon Budget (CB) variant to each of the cases used in this analysis.
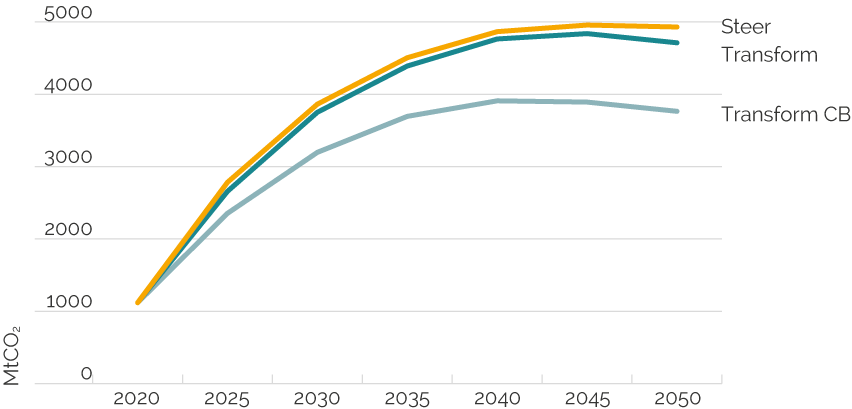
In Figure 14, this budget is shown implemented with the Transform demand scenario, as Transform CB. The lower energy demand case allows for stronger near-term reductions with incremental changes occurring in the CB variant as early as 2025 (grey marker). By 2030 this scenario sees a 47% emissions reduction relative to 2020, compared to 37% under Steer demand. This level of climate ambition can be achieved without engineered removals and at additional costs that only marginally exceed those observed under Transform demand, as shown in Figure 14. Crucially, this earlier action also keeps the window open for further strengthening of climate ambition. The less ambitious LED scenario, Shift demand, is also able to achieve this tighter carbon budget.